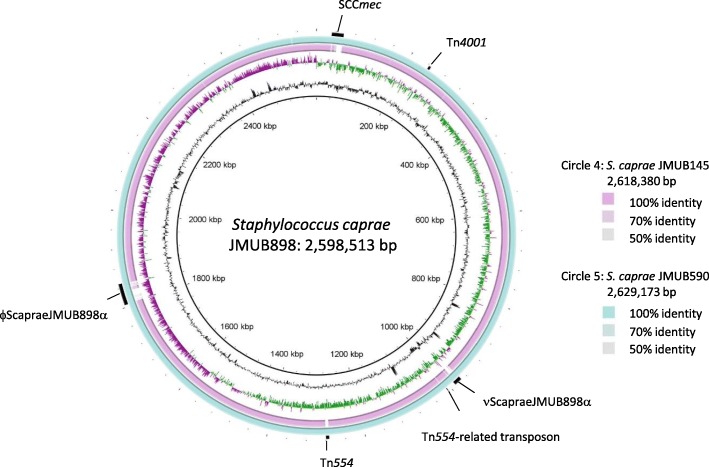
Fig. 1.
Circular representation of the genome comparison of three Staphylococcus caprae strains. Circle 1 (innermost circle) and circle 7 (outermost circle) indicate the distances from the putative origin of replication of the S. caprae JMUB898 chromosome. Circles 2 and 3 designate the GC content (black) and GC skew (green, plus strand; purple, minus strand). Circle 4 shows nucleotide identities between S. caprae JMUB145 and JMUB898 chromosomes calculated by blastn (light blue). Circle 5 represents nucleotide identities between S. caprae JMUB590 and JMUB898 chromosomes. Circle 6 shows prophages, genomic islands, and transposons (black). The S. caprae genomes are compared and visualized by BLAST Ring Image Generator v0.95 [19]

