
Fig. 7.
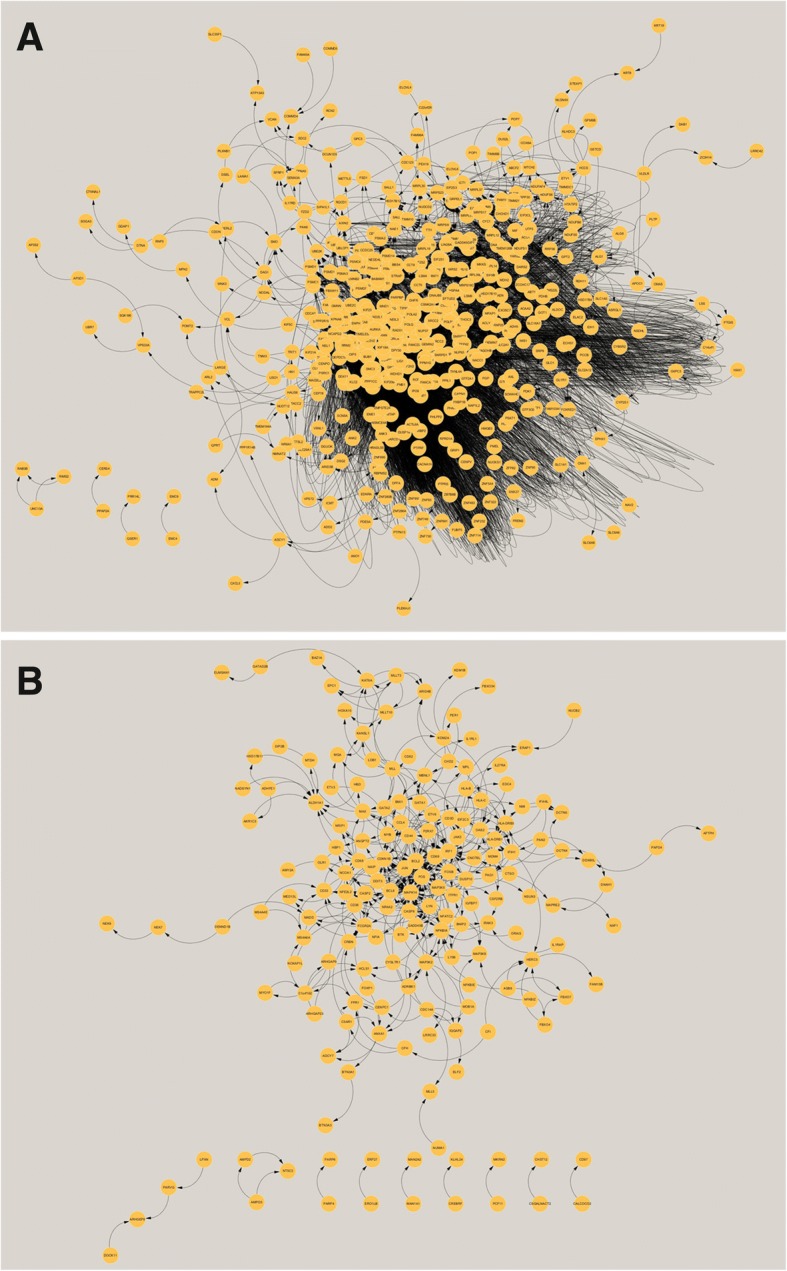
PPI network analysis. A PPI network was visualized by Cytoscape, a for profile 0 and b for profile 13. The yellow circles indicate the genes identified by the Cytoscape program. Black arrows indicate connections between genes
Official websites use .gov
A
.gov website belongs to an official
government organization in the United States.
Secure .gov websites use HTTPS
A lock (
) or https:// means you've safely
connected to the .gov website. Share sensitive
information only on official, secure websites.
PPI network analysis. A PPI network was visualized by Cytoscape, a for profile 0 and b for profile 13. The yellow circles indicate the genes identified by the Cytoscape program. Black arrows indicate connections between genes