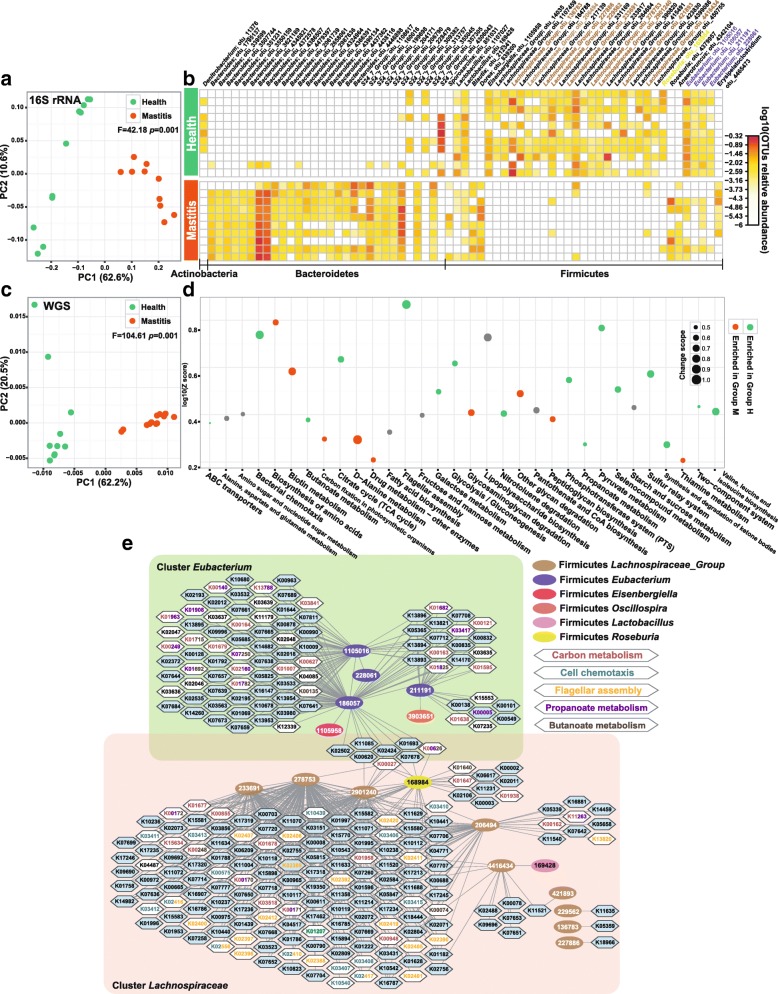
Fig. 4.
Distinction between healthy and mastitis intestinal microbiota in the mice after FMT. a PCoA clustering of the organismal structure of microbiota based on Meta-Storm distance. Percentage of variation explained by each principal coordinate is indicated on the axes. b Heat map of the 66 differential OTUs between group M and group H of mice. Relative abundance was shown as log 10 based. c PCA of functional gene structure between group M and group H of mice. d Significantly changed pathways of murine gut microbiota between group M and group H of mice. e Correlation network of differential OTUs and KOs, which revealed the taxon-function links

