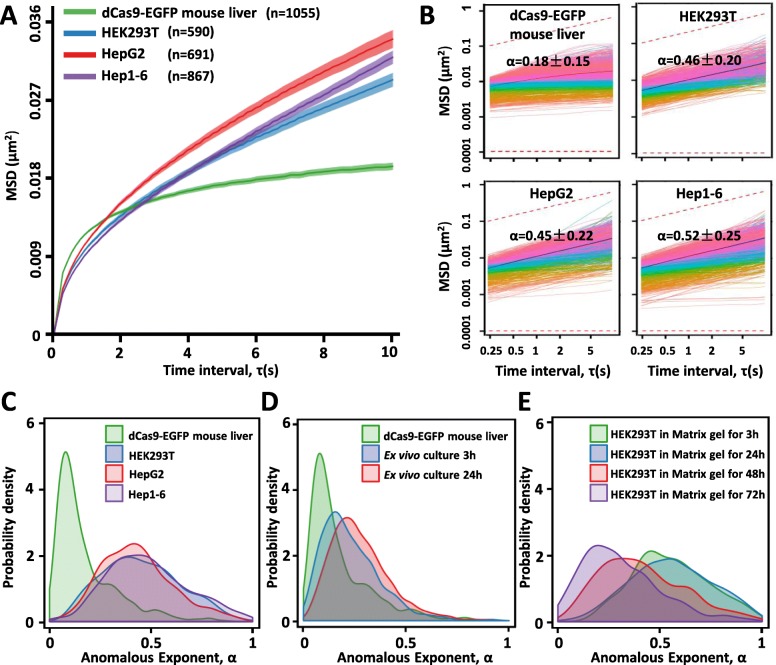
Fig. 2.
Unique features of telomere dynamics in mouse liver revealed by dCas9-EGFP knock-in mice. a The average MSD curves of telomeres in dCas9-EGFP mouse liver and cultured cell lines (HEK293T, HepG2, and Hep1-6). The data are displayed as mean ± SE. b MSD curves of individual telomeres (colored curves) and the average MSD curves (bold black curve with shaded area indicating ± SE) as a function of time interval between observations. The upper red dashed line: slope = 0.5. The bottom red dashed line: slope = 0. c Distribution of α values calculated for individual telomeres of dCas9-EGFP mouse liver and cultured cell lines (HEK293T, HepG2, and Hep1-6). d Distribution of α values calculated for individual telomeres of dCas9-EGFP mouse liver and ex vivo hepatocytes cultured for 3 and 24 h. e Distribution of α values calculated for individual telomeres of HEK293T cells cultured in Matrix gel for 3, 24, 48, and 72 h (cells at 3 and 24 h were single cells without cell-cell interactions, and cells at 48 and 72 h were within cell clusters with cell-cell interactions). The data were collected from at least three mice

