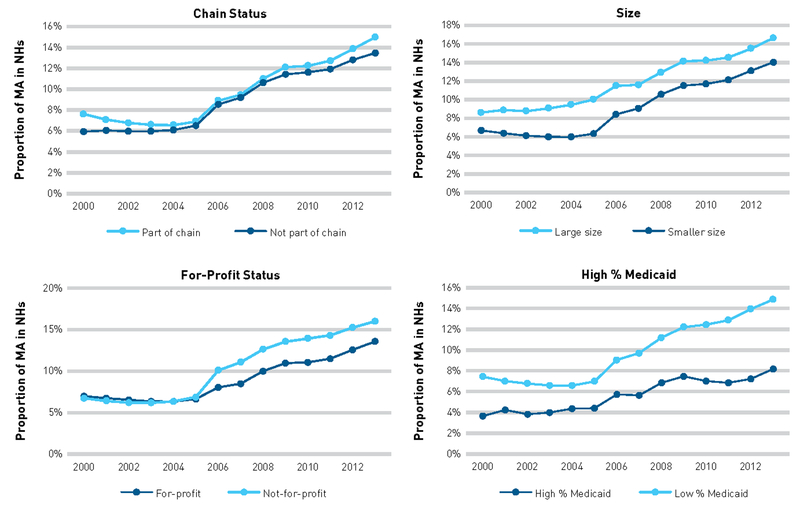
FIGURE 2. Trends in the Proportion of NH Patients Covered by MA, by NH Characteristicsa.
MA indicates Medicare Advantage; NH, nursing home. aDetails of the variables are described in the Methods section. “High % Medicaid” indicates NHs with 90% or more Medicaid patients. “Low % Medicaid” indicates NHs with less than 90% Medicaid patients.

