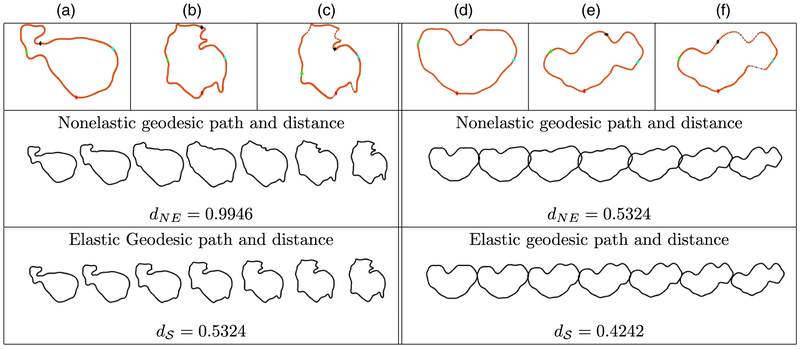
Fig. 4.
(a), (b), (c) Comparison of T1 tumour shapes for patients with survival times of 14.3 and 29.2 monthsand (d), (e), (f) comparison of T1 tumour shapes for patients with survival times of 8.8 and 48.6 months (we show four coloured points of correspondence for improved visualization; the resulting geodesic paths are sampled uniformly by using seven points (NE, non-elastic)): (a), (d) curve representing the first tumour; (b), (e) curve representing the second tumour before reparameterization (uniform spacing of points); (c), (f) same as (b) and (e) after reparameterization (optimal non-uniform spacing of points)

