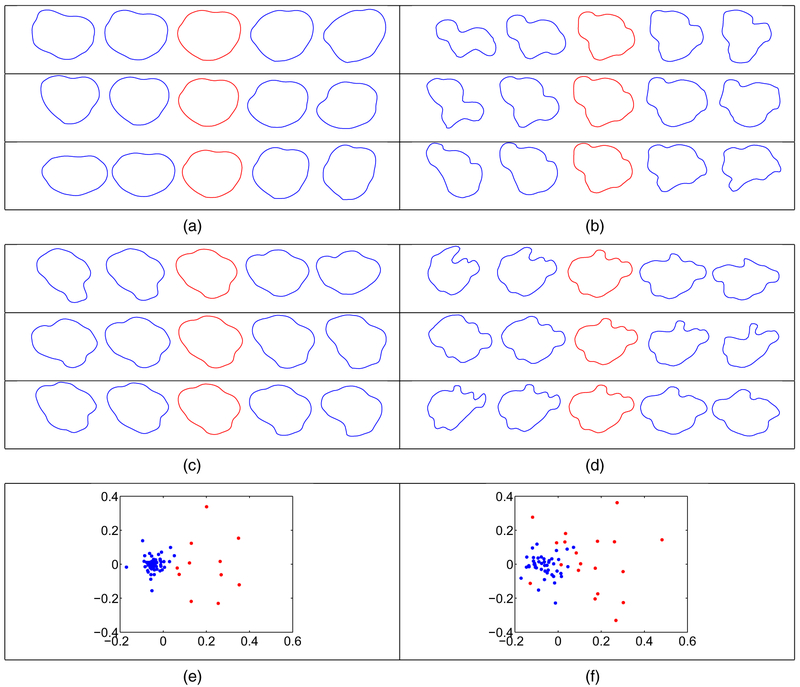
Fig. 8.
Clusterwise principal directions of variation for T1 and T2 tumour shapes (in each example, we display the path within 2 standard deviations of the mean (red)): (a) T1 cluster 1; (b) T1 cluster 2; (c) T2 cluster 1; (d) T2 cluster 2; (e) multi-dimensional scaling plot of the T1 tumour shape data ( , cluster 1;
  , cluster 2); (f) multi-dimensional scaling plot of the T2 tumour shape data (
 , cluster 1;
  , cluster 2)

