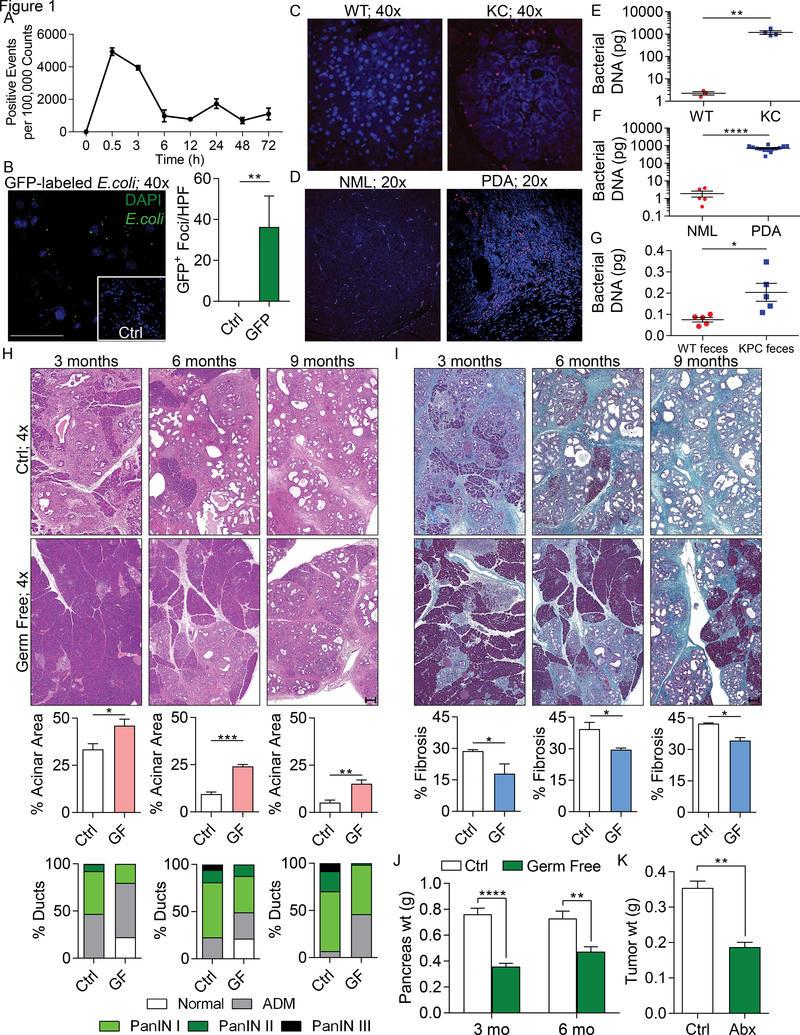
Figure 1. The tumorous pancreas has an abundant microbiome and its ablation is protective against pancreatic disease progression.
(A) WT mice were administered CFSE-labeled E. faecalis (2.5×10⁸ CFU) via oral gavage. Pancreata were harvested and digested at the indicated timed intervals and tested for the presence of these bacteria (n=3 mice/time point). This experiment was repeated twice with similar results. (B) WT mice were administered GFP-labeled E. coli (2.5×10⁸ CFU) via oral gavage. Pancreata were harvested at 6h and the number of GFP+ foci was determined by immune fluorescence microscopy compared to control. This experiment was repeated twice (n=3; **p<0.01; scale bar =50μm). (C) The abundance of intra-pancreatic bacteria was compared in 3-month-old WT and KC mice by FISH (n=5/group). Representative images are shown. This experiment was repeated twice. (D) The abundance of intra-pancreatic bacteria was compared in healthy individuals and age/gender/BMI matched PDA patients by FISH (n=5/group). Representative images are shown. (E) Bacterial DNA content was compared in WT and KC mice using qPCR. Each dot represents data from a single mouse pancreas. This was repeated three times (**p<0.01). (F) Bacterial DNA content was compared in healthy individuals (NML) and age/gender/BMI matched PDA patients using qPCR. Each dot represents data from a single human pancreas (****p<0.0001). (G) 8-week old WT mice were treated with an ablative oral antibiotic regimen. 3 weeks after treatment, mice were repopulated using fecal bacteria from either 3 month-old WT or KPC mice. Bacterial colonization of the pancreas was analyzed by qPCR 2 weeks after repopulation. This experiment was repeated twice (n=5/group; *p<0.05). (H-J) Control and germ-free KC mice were sacrificed at 3, 6, or 9 months of life. Representative (H) H&E- and (I) trichrome-stained sections are shown. The percentage of ducts exhibiting normal morphology, acinoductal metaplasia (ADM), or graded PanIN lesions were determined based on H&E staining. The fraction of fibrotic area per pancreas was calculated based on trichrome staining (scale bars = 200μm). (J) Pancreatic weights were recorded at 3 or 6 months of life (n=10/group; *p<0.05, **p<0.01, ***p<0.001, ****p<0.0001). (K) WT mice were treated with an ablative oral antibiotic regimen and then orthotopically inoculated with KPC-derived PDA cells. Animals were sacrificed at 3 weeks and tumor weights were recorded (n=4/group; **p<0.01). This experiment was repeated more than 5 times with similar results.

