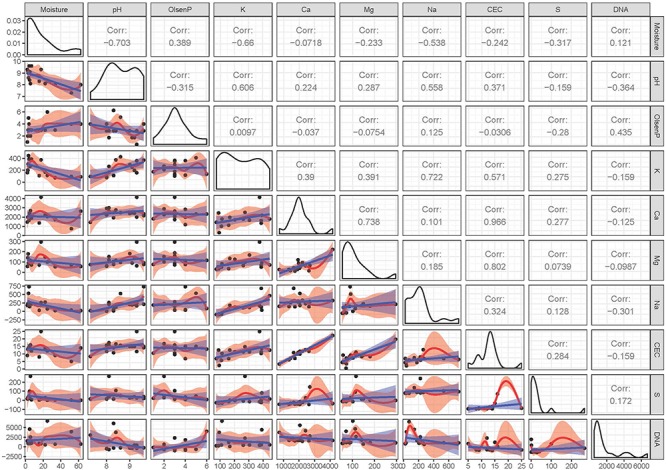
FIGURE 2.

Pairwise comparison of multivariate geochemistry data from the soil samples. The upper diagonal displays the correlations, the diagonal boxes show the densities, and a matrix of scatterplots are shown in the lower diagonal. Linear regressions and 95% confidence intervals in the scatterplots are represented by blue lines/areas. Red lines/areas represent local regressions and their 95% confidence intervals. Moisture was measured in percentage; pH in pH unit; Olsen P (bicarbonate-extractable P), K, Ca, Mg, Na, and S (Sulfur and Sulfate) were measured in mg per kg of soil; cation-exchange capacity (CEC) was measured in me per 100 g of soil. DNA yield was measured in ng/g soil.
