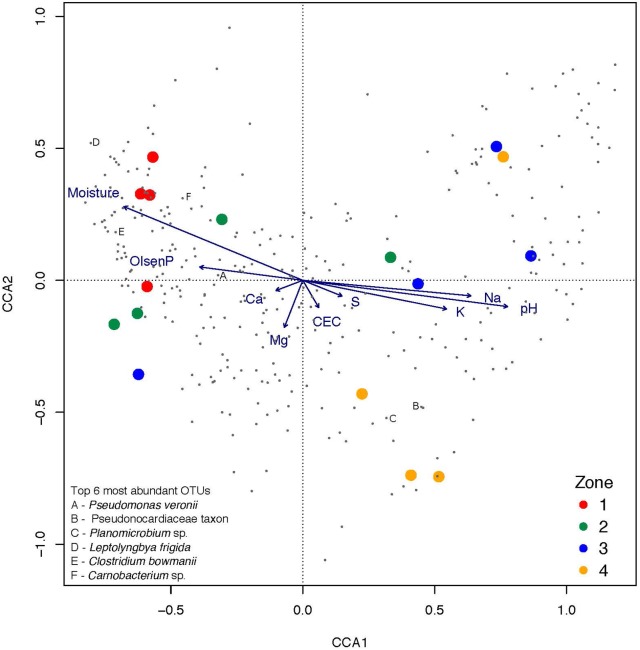
FIGURE 3.
The relationship between samples, OTUs, and geochemical factors visualized via canonical correspondence analysis (CCA) with type III (symmetric) scaling. Samples from the zones, ranging from closest (1) to furthest (4) away from the pond are represented by color-coded circles and individual OTUs are represented as dots. Top six overall most relatively abundant OTUs are specifically marked. Quantitative explanatory variables are represented by as arrows. Proximity of the samples and OTUs to the direction of the arrow indicates likelihood the response variables are to be found with the geochemical factor.

