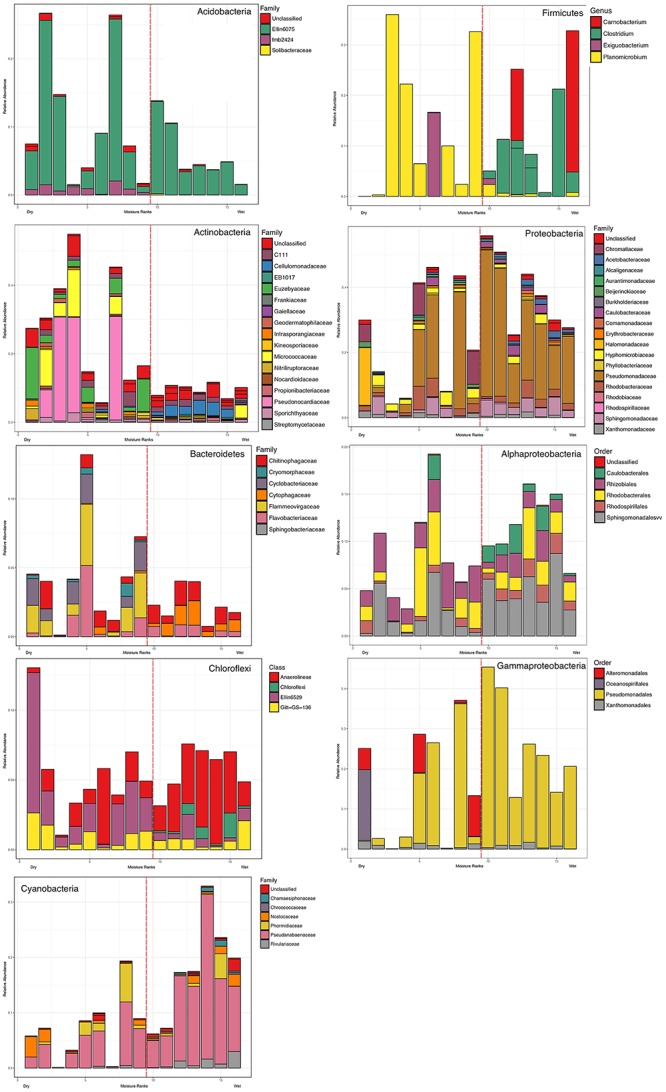
FIGURE 6.

Taxa distribution of soil arranged in the order of the moisture gradient (lowest, 2.2% to highest, 62.56%). The stack bar plots show relative abundance of the taxa of interest to total bacterial abundance. Detailed taxonomic levels therein (e.g., Order, Family, Genus) are shown to illustrate response to moisture at lower taxonomic rank for abundant phyla. The dotted red line indicates the moisture threshold where shifts in member taxa were most common. The position of the dotted red line in each plot is based on rank order position of the threshold between sample ranked 9–10 in moisture content (dry to wet) which corresponds to the 6.82–15.57% threshold.
