Figure 7.
Validation of HOXD-AS1 in TCGA cohort.
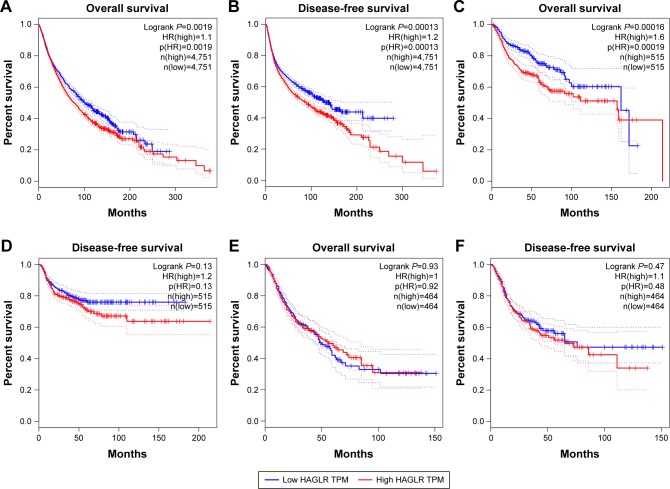
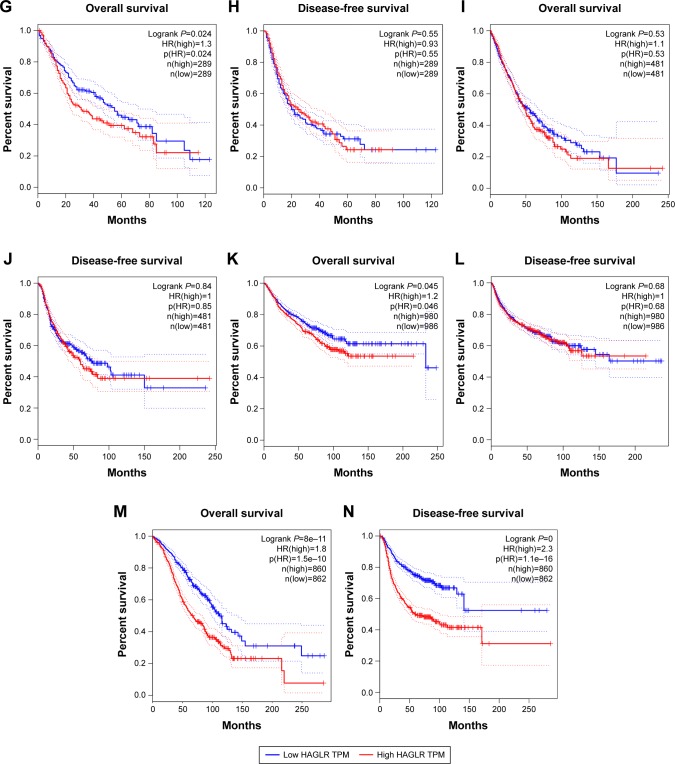
Notes: (A) Overall survival plots of HOXD-AS1 in TCGA cohort (n=9,502, logrank P<0.01). (B) Disease-free survival plots of HOXD-AS1 in TCGA cohort (n=9,502, logrank P<0.01). (C) Overall survival plots of HOXD-AS1 in TCGA cohort in head and neck tumor (n=1,030, logrank <0.01). (D) Disease-free survival plots of TCGA cohort in head and neck tumor (n=1,030, logrank P=0.13). (E) Overall survival plots of HOXD-AS1 in TCGA cohort in the gastrointestinal tumor system (n=928, logrank =0.93). (F) Disease-free survival plots of TCGA cohort in gastrointestinal tumors (n=928, logrank P=0.47). (G) Overall survival plots of HOXD-AS1 in the TCGA cohort in hepatobiliary and pancreatic system (n=578, logrank =0.024). (H) Disease-free survival plots of TCGA cohort in the hepatobiliary and pancreatic system (n=578, logrank P=0.55). (I) Overall survival plots of HOXD-AS1 in TCGA cohort in the respiratory system (n=962, logrank =0.53). (J) Disease-free survival plots of TCGA cohort in the respiratory system (n=962, logrank P=0.84). (K) Overall survival plots of HOXD-AS1 in TCGA cohort in the urinary system (n=1,966, logrank =0.045). (L) Disease-free survival plots of TCGA cohort in the urinary system (n=1,966, logrank =0.68). (M) Overall survival plots of HOXD-AS1 in TCGA cohort in the female reproductive system (n=1,762, logrank <0.01). (N) Disease-free survival plots of TCGA cohort in the female reproductive system (n=1,762, logrank <0.01).
Abbreviation: TCGA, The Cancer Genome Atlas.


