
Figure 2.
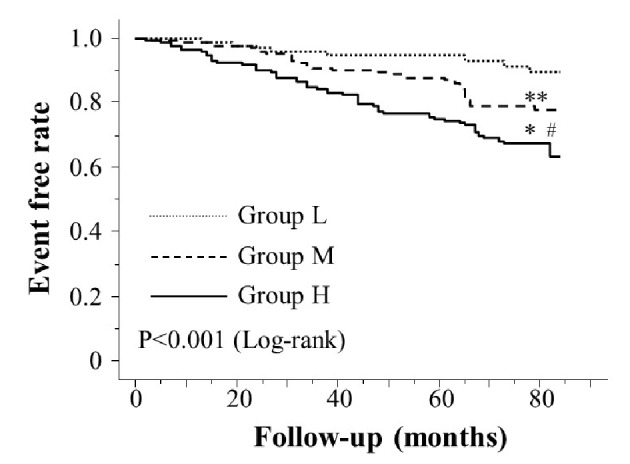
Kaplan-Meier curve for the incidence of major adverse cardiovascular events. The Kaplan-Meier curve confirmed that group H had a significantly higher incidence of major adverse cardiovascular events compared with groups M and L (log-rank test, P < 0.001). *P < 0.001 vs. group L, **P = 0.112 vs. group L, #P < 0.001 vs. group M.