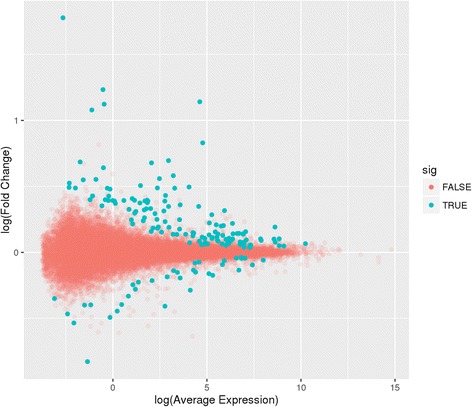
Fig. 1.

Mean-Average(MA)-plot of log2 average expression versus log2 fold change between current and former smokers. Log fold change values greater than zero indicate genes with higher expression in current smokers (n = 136 genes), Log fold change values less than zero indicate genes with higher expression in former smokers (n = 35 genes). Blue dots indicate genes that are significantly differentially expressed (adjusted p value <0.05)
