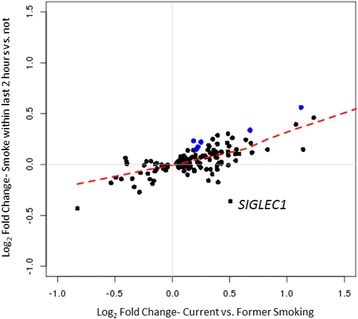
Fig. 2.

Comparison of effect sizes between differential expression analyses of: 1) current versus former smoking (defined as smoking cigarettes within the past month) on the x-axis and 2) acute smoking (defined as smoking cigarettes within the past 2 h) on the y-axis. Each point represents a differentially expressed gene in the current smoking analysis (n = 171). Blue dots represent 6 genes significantly differentially expressed between those who have smoked within the past 2 h and those who have not (Bonferroni corrected for 171 genes). The red line is a fitted via lowess smoothing. The labeled gene (SIGLEC1) shows an opposite direction of effect between the 2 analyses (logFC current smoking = 0.51, logFC acute smoking = −0.36)
