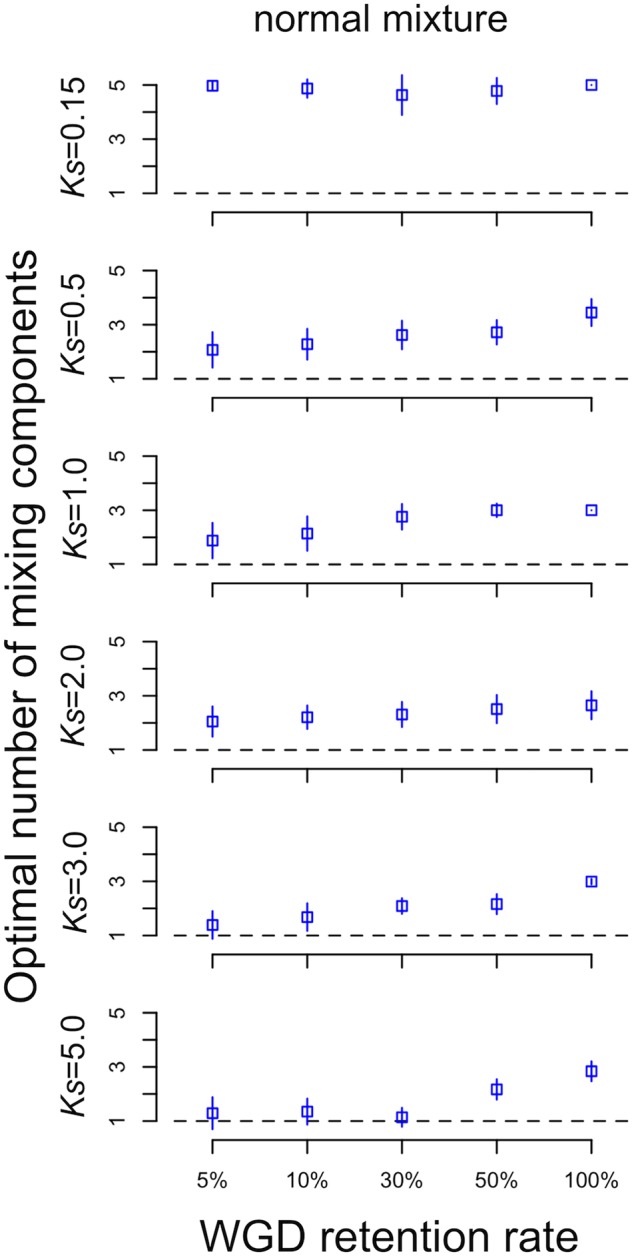
Fig. 4.

—The average number of components for simulated WGD events at different ages and retention rates when only using gene pairs that are products of a WGD event. Results for node-averaged estimates of Ks are squares and pairwise Ks estimates are triangles. Error bars represent one standard deviation. The dashed line represents the expected number of components, which is always one in the case of a single WGD event and syntenic data.
