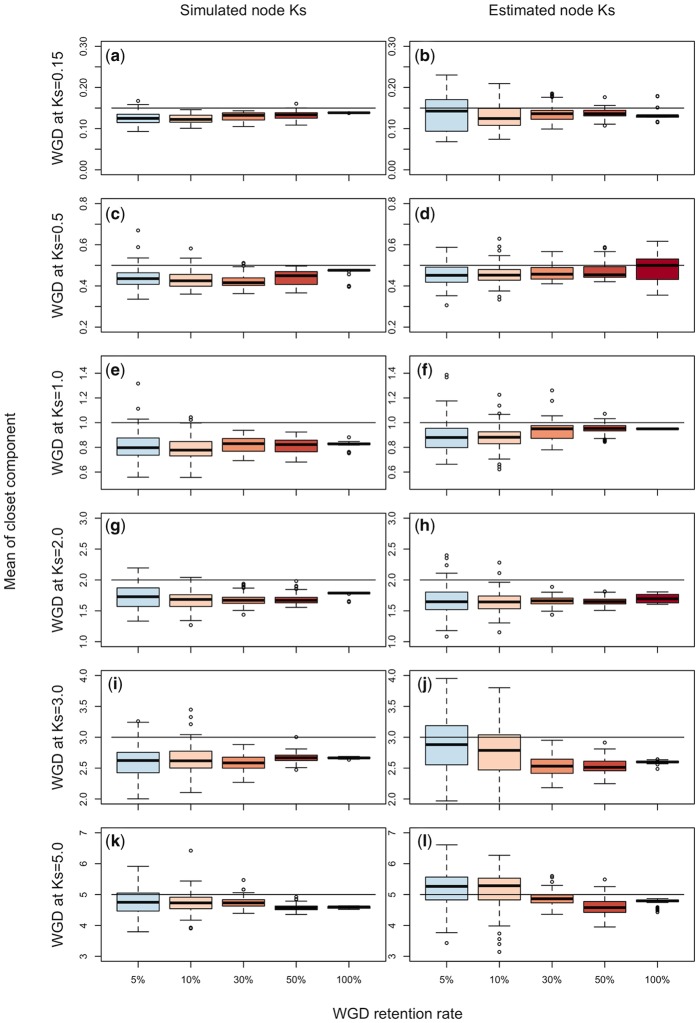
Fig. 5.
—Distributions of the means of components closest to the true age of the WGD at Ks = 0.15, 0.5, 1.0, 2.0, 3.0, and 5.0, when the number of components for a normal mixture model is optimized by ML. Distributions are shown for known and estimated node-averaged Ks of syntenic data. Horizontal black lines represent the true age of a WGD.

