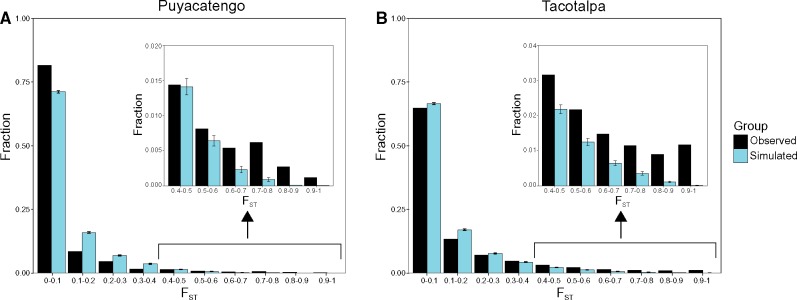
Fig. 2.
—Simulated and observed FST distributions for SNPs between the adjacent sulfidic and nonsulfidic populations in the (A) Puyacatengo drainage (observed mean = 0.064) and in the (B) Tacotalpa drainage (observed mean = 0.111). Insets show the right-hand tail of the FST distributions for the Puyacatengo and the Tacotalpa drainages, respectively. Simulated FST distributions were generated using ms (Hudson 2002), based on the best fit demographic models estimated using δaδi (Gutenkunst et al. 2009). The distributions shown here are averages of 1,000-ms simulations. Error bars represent 95% confidence intervals for the simulated FST distributions.

