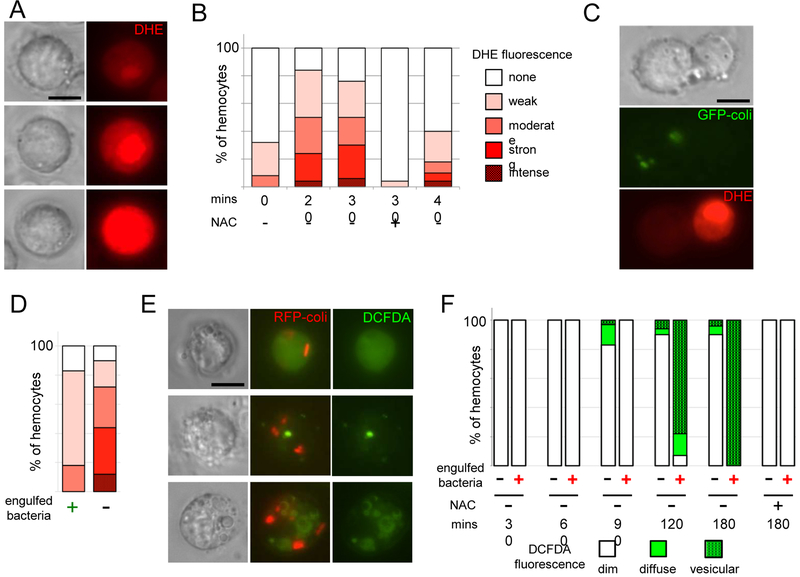
Fig. 1.
Biphasic ROS production by larval hemocytes following bacterial infection. (A) Examples of DHE fluorescence intensity in hemocytes 30 mins after infection. Top: moderate; Middle: strong; Bottom: intense. (B) Quantification of DHE fluorescence intensity frequencies in hemocytes analysed at time points following bacterial infection (see Methods). (C) 30 mins after infection with GFP expressing E. coli, left cell has engulfed bacteria, and has weak DHE fluorescence; right cell has not engulfed bacteria and has strong DHE fluorescence. (D) Quantification of DHE fluorescence intensities among hemocytes that have (left) and have not (right) engulfed bacteria at 30 mins postinfection, as in (C). 80 hemocytes were examined; about 50% of hemocytes have visible bacteria at this time point. Scale as in (B). (E) Examples of DCFDA (green) fluorescence in hemocytes 2 hours following infection with RFP-expressing E. coli. Top: diffuse fluorescence; Middle & Bottom: vesicular fluorescence. (F) Quantification of DCFDA fluorescence patterns in hemocytes analysed at time points following bacterial infection. NAC: 10mM. Results are representative of at least 3 experiments. Percentages in B, D, F derived from counts of ≥ 50 hemocytes from single experiment. Scale bars: 5 μm.

