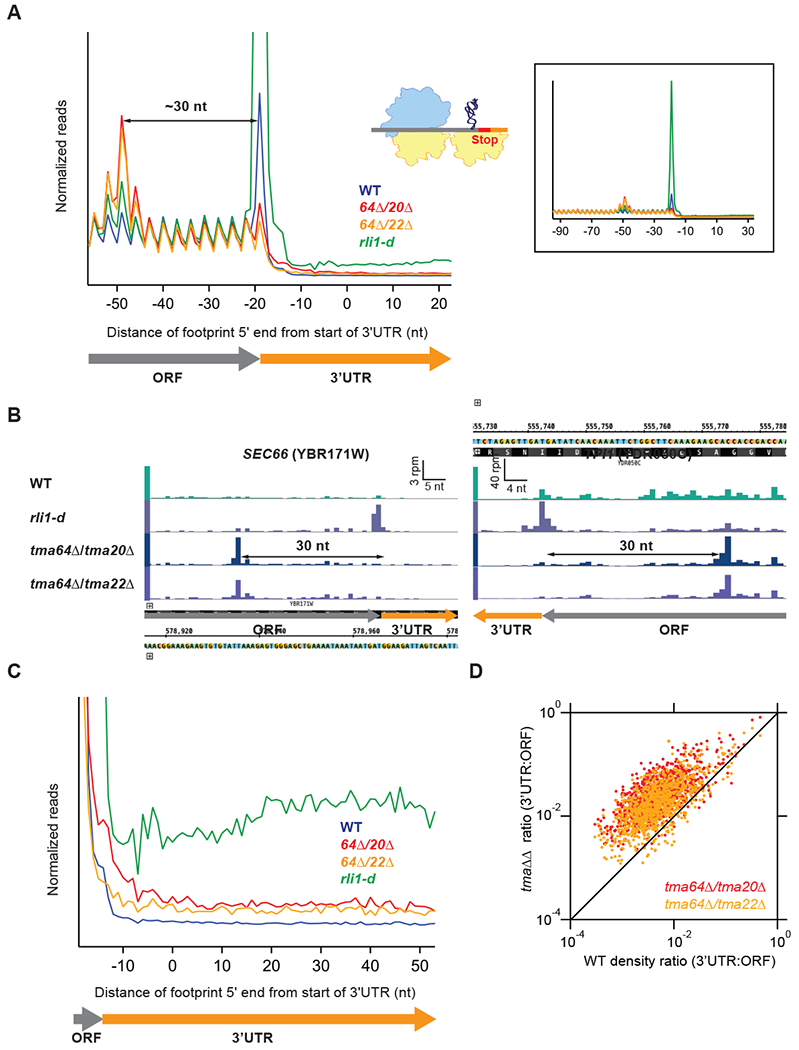
Figure 1. Deletion of TMA64 and TMA20 or TMA64 and TMA22 results in stalling of the penultimate elongating ribosome and increased 3’UTR ribosome occupancy.

(A) Normalized average ribosome footprint occupancy (each gene weighted equally) from all genes aligned at their stop codons for WT, tma64Δ/tma20Δ, tma64Δ/tma22Δ, and rli1-d cells. Footprint 5’ ends are plotted. The schematic depicts a 40S subunit at the stop codon stalling and queuing of the penultimate elongating 80S ribosome.(Inset) Demagnified view of (A), showing full extent of ribosome stalling.
(B) Ribosome footprint profiles of genes SEC66 and TPI1 showing ribosome occupancy peaks 30 nt upstream of the stop codon that represent stalled elongating 80S ribosomes. Reads are shifted so peaks approximately correspond to ribosome A sites.
(C) Normalized average ribosome footprint occupancy for the first 60 nt of the 3’UTRs of all genes, magnified from (A).
(D) Ratio of footprint densities in 3’UTRs to the respective ORFs is plotted for tma64Δ/tma20Δ and tma64Δ/tma22Δ versus WT cells, for genes with >5 rpkm in ORFs and > 0.5 rpkm in 3’UTRs. Each point represents the data for 1 gene, revealing extensive ribosome occupancy in the 3’UTRs of most genes.
