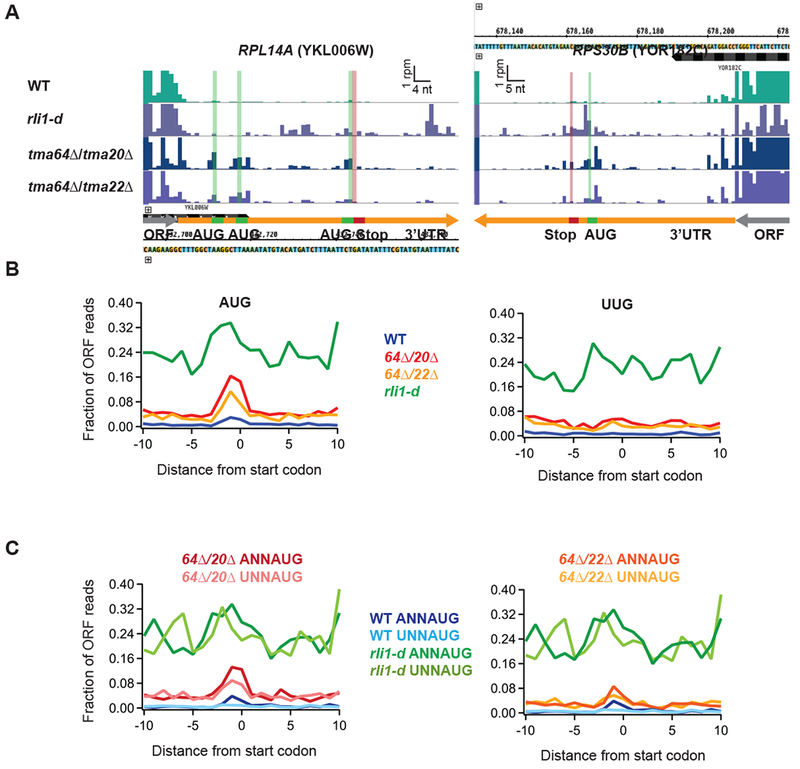
Figure 2. Ribosome occupancy peaks are observed at 3’UTR AUG codons consistent with 40S reinitiation.

(A) Ribosome footprint profiles of the 3’UTRs of genes RPL14A and RPS30B showing ribosome occupancy peaks at 3’UTR AUG codons. Green line and bars represent AUG start codon(s) and red lines and bars represent stop codons in the same frame. Gene annotations are drawn to correspond to data for ribosome P sites (AUG codons) or A sites (stop codons). Note that the 3rd AUG and stop codon for RPL14A are slightly offset for visibility.
(B) Average fraction of ribosome occupancy in a window surrounding 3’UTR AUG codons (left) and 3’UTR near-cognate UUG codons (right) normalized to ORF ribosome occupancy level (all frames included). Data shown for WT, tma64Δ/tma20Δ, tma64Δ/tma22Δ, and rli1-d cells. Reads are shifted so peaks approximately correspond to ribosome P sites.
(C) Average ribosome occupancy on AUG codons, as for B (left), but data are filtered according to start codon context: ANNAUG strong context and UNNAUG weak context for tma64Δ/tma20Δ (left) and tma64Δ/tma22Δ (right). Reads are shifted so peaks approximately correspond to ribosome P sites.
