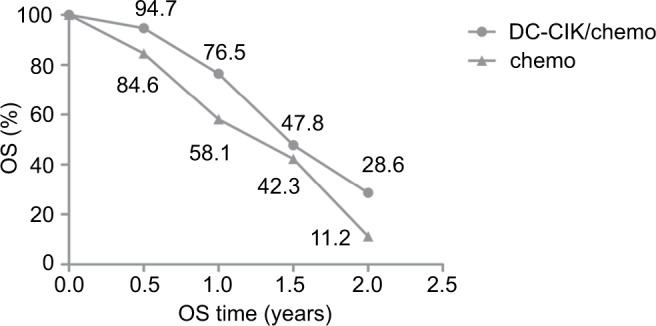
Figure 4.

Mean survival curve for the combination therapy (DC-CIK/chemo) and control (chemo) groups.
Notes: A paired t-test was used for statistical analysis (P=0.025; P-values less than 0.05 were considered significant).
Abbreviations: DC-CIK/chemo, DC-CIK immunotherapy combined with chemotherapy; chemo, chemotherapy alone; OS, overall survival.
