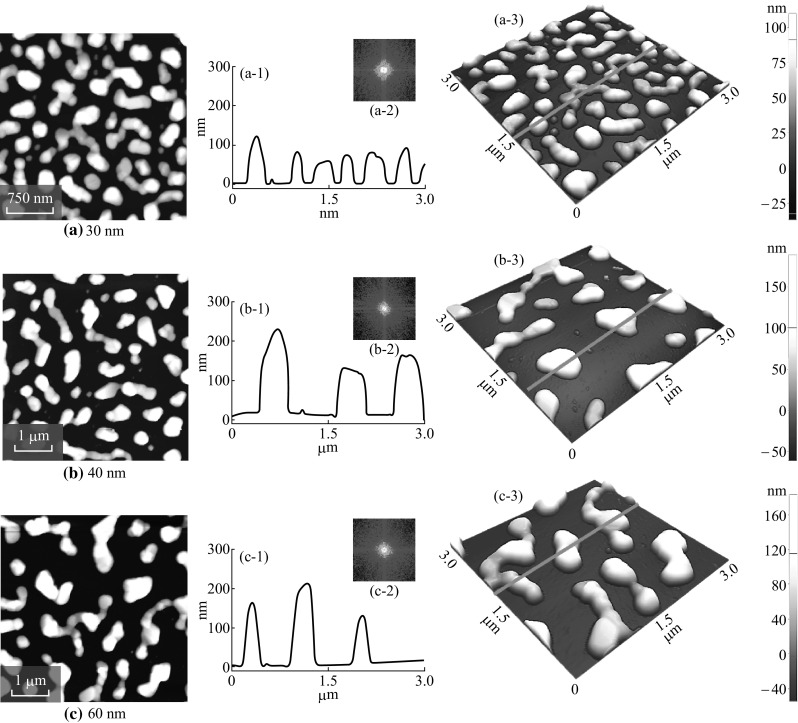
Fig. 2.

Evolution of merged and irregular Ag nanoclusters on sapphire (0001) with various thicknesses (30–60 nm) of Ag annealed at 550 °C for 180 s. AFM top-views of 3 × 3 µm2 in a and 5 × 5 µm2 in b–c. a-2 to c-2 Cross-sectional line profiles with respect to the line in a-3 to c-3. a-2 to c-2 FFT power spectra. a-3 to c-3 AFM side-views of 3 × 3 µm2
