
Fig. 2.
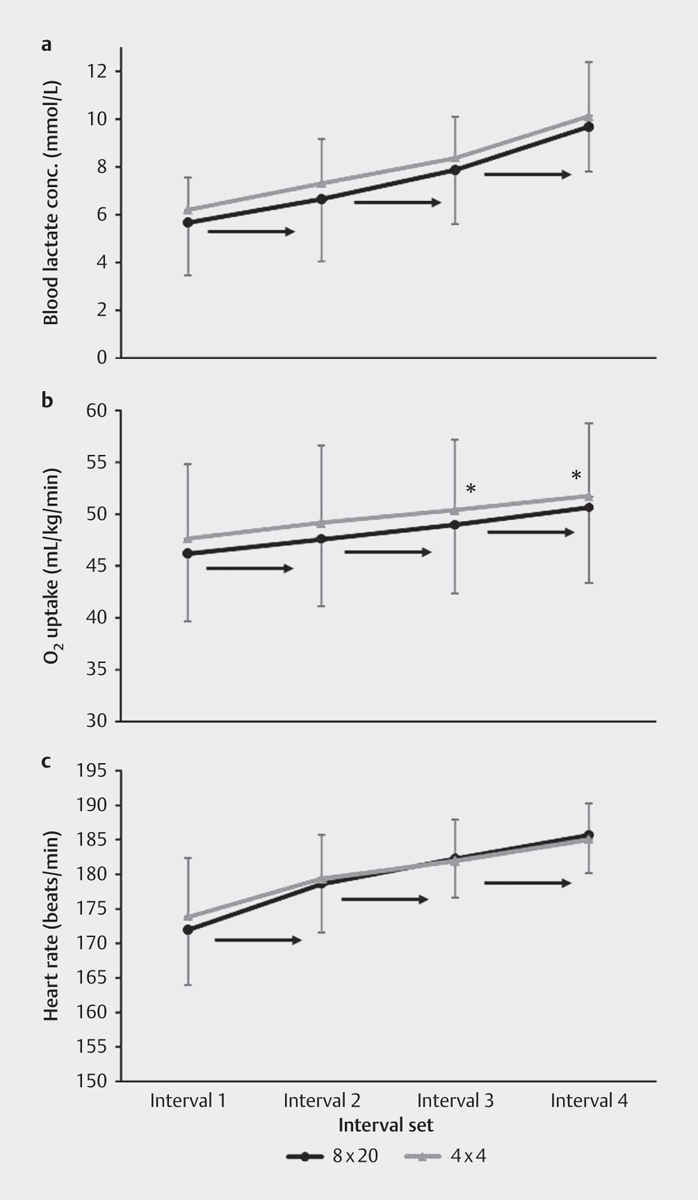
Oxygen uptake a , blood lactate concentration b , and heart rate c after each set during the short- and long-interval sessions. → indicates a significant increase from this value, P<0.05 level. * Significant (P<0.05) difference between the short- and long-interval sessions at this set.