
Figure 1.
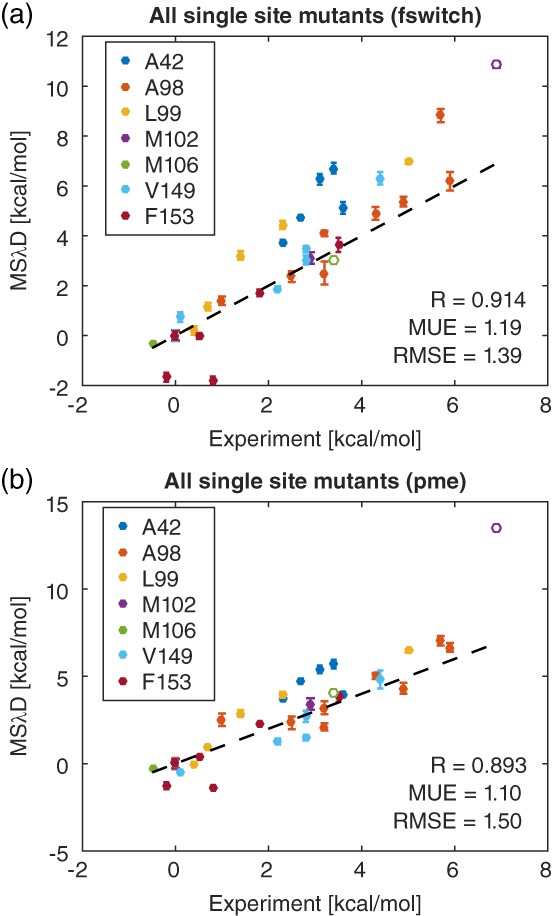
Comparison between predicted MSλD and experimental folding free energies at all seven mutation sites using (a) FSWITCH and (b) PME electrostatics. Open circles denote charged mutants M102K and M106K. Dashed lines denote y = x, and free energies are plotted relative to wild type with C54T/C97A.