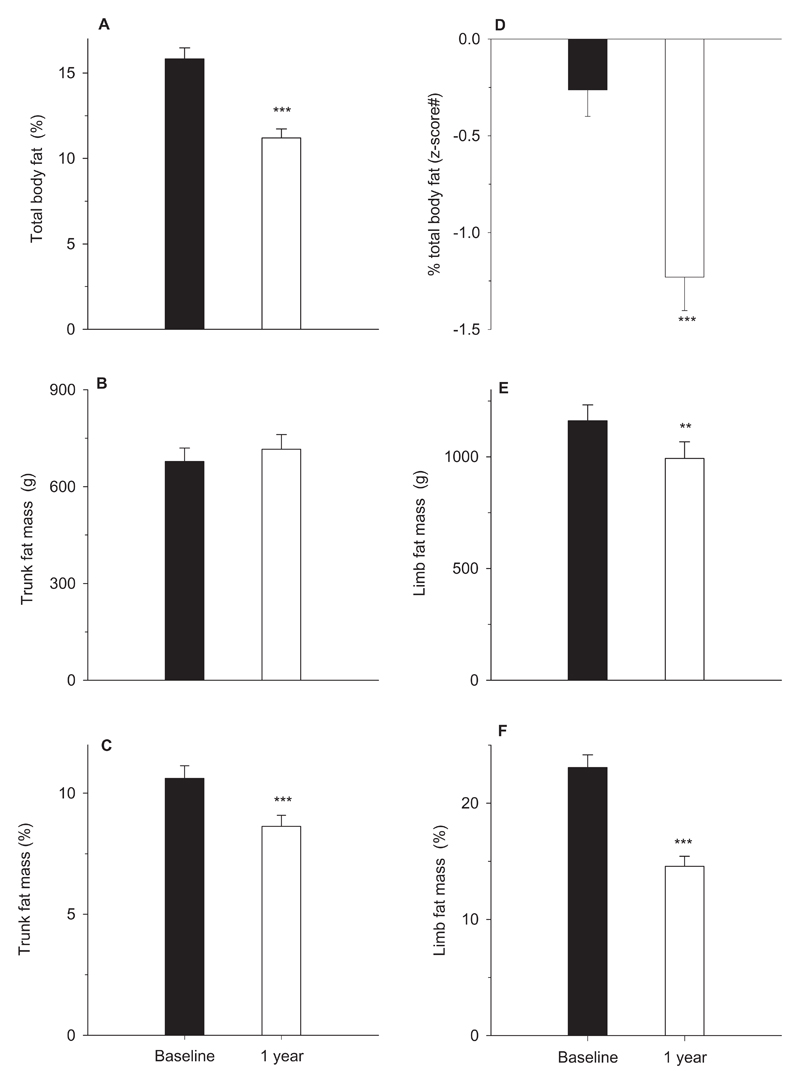
Figure-1. Changes in body fat during Growth Hormone treatment.
Total body fat percentage (A), z-scores for total body fat percentage (D), trunk fat mass in grams (B) and as percentage of total trunk mass (C), limb fat mass in grams (E) and as percentage of total limb mass (F). Bars represent means and error bars the standard error of means. Black and empty bars represent measurements at baseline and 1-year respectively; # z-scores for total body fat percentage are based on normative data (z-scoresp); p-values (*) are from the comparison between baseline and 1-year measurements; **, p<0.001 and ***, p<0.0001;

