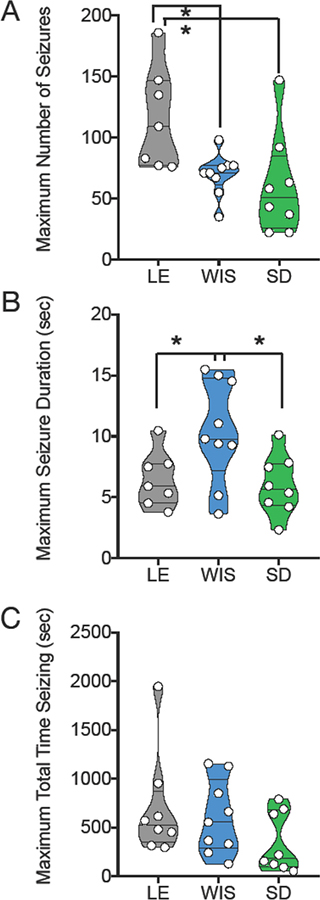
Figure 3. Strain effects with maximum response collapsed across dose.
Violin plots showing (A) Number of SWDs detected during the observation period, (B) mean duration of individual SWDs, (C) total time displaying SWDs (number × mean duration). Circles indicate individual subjects. Data for this figure represents the maximum within subject response for each parameter. * = significantly different, P<0.05. LE = Long Evans, WIS = Wistar, SD = Sprague-Dawley

