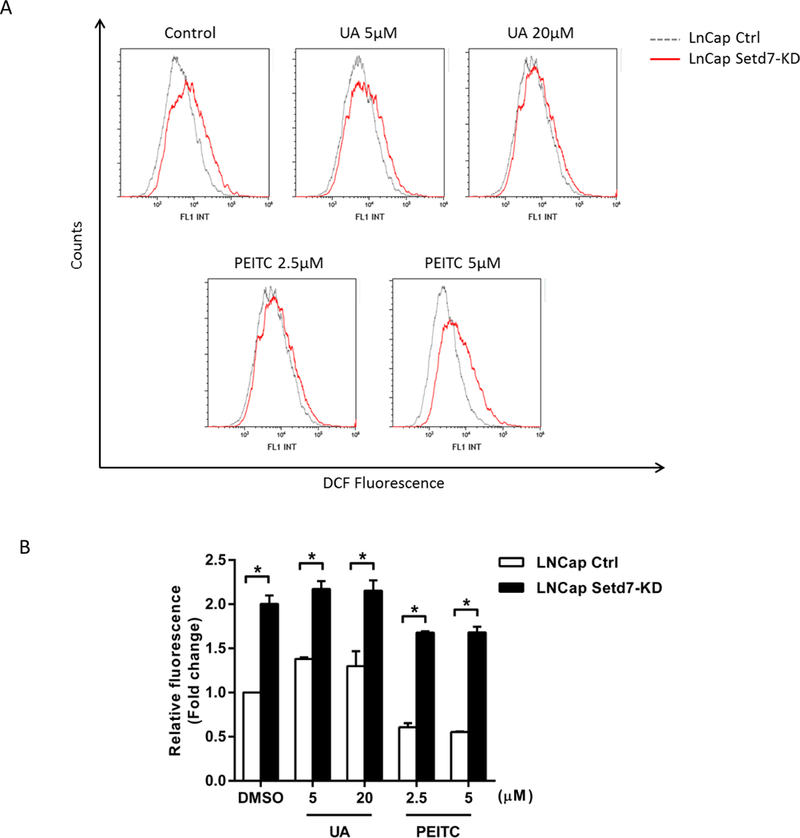
FIGURE 4.

Setd7 down-regulation increased ROS generation. (A) LNCaP and LNCaP Setd7-KD cells were treated with the indicated concentrations of PEITC and UA for 12 h, incubated with 10 μM CM-H2DCFDA for a total of 30 min, and then analyzed via flow cytometry. (B) Fold changes in DCF fluorescence in LNCaP and LNCaP Setd7-KD cells. The data presented in panel A are representative of three independent experiments, and the statistical results from these experiments are presented in panel B (* p < 0.05, significantly different compared with the LNCaP cell line).
