
Figure 4:
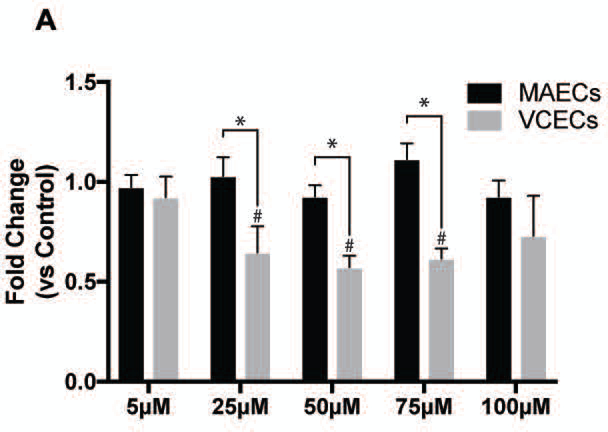
Proliferation of MAECs and VCECs post treatment with increasing µM levels of BSO (0,5,25,50,75,100) for 19hrs. * Represents significance between MAECs and VCECs normalized to respective untreated control shown as fold change. # Represents significance within VCECs compared to untreated control (n=3, X±SE significant at */# p ≤ 0.05).