
Figure 5:
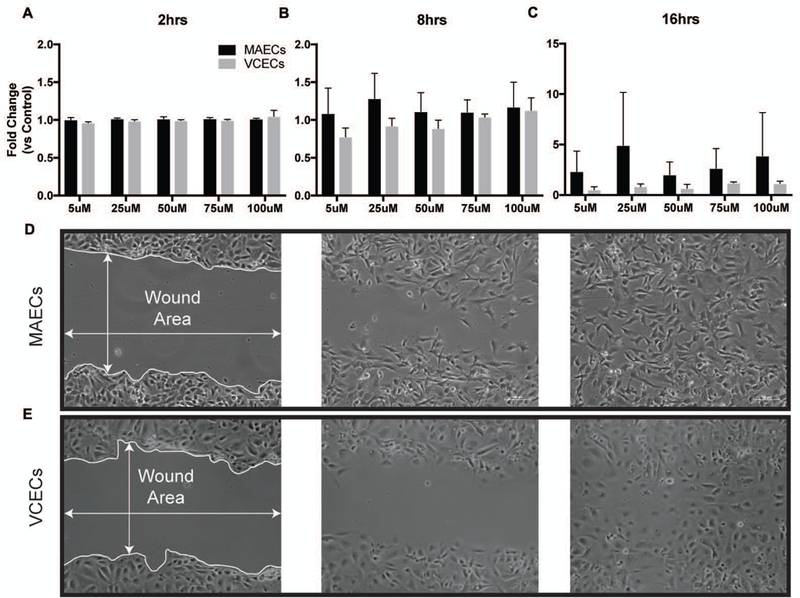
Wound closure rates of MAECs and VCECs following administration of increasing µM levels of BSO (0,5,25,50,75,100) for 16hrs. Bars represent fold change compared to initial wound area and normalized to untreated control for 2hrs (A), 8hrs (B) and 16hrs (C). D. Wound healing assay showing representative bright field images for MAECs (D) and VCECs (E) with closing wound areas at 2hrs, 8hrs and 16hrs.