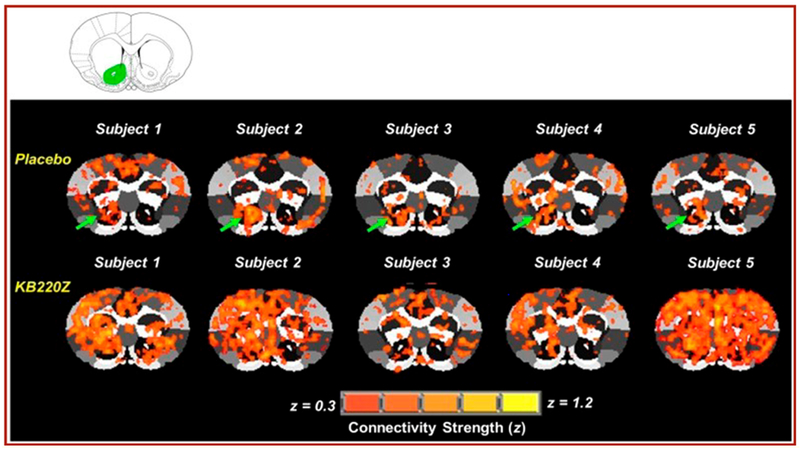
Figure 9:

Represents cross-correlation fMRI maps of five rodents that show: Placebo compared to KB220Z treated rats. The maps correspond to resting state connectivity for the NAc (highlighted in green in the atlas map above the figure; only left seed is shown). Note the distributed but significant connectivity between various brain regions and the NAc in the placebo subjects. KB220Z increased connectivity, especially between left-right accumbens, dorsal striatum, and limbic cortical areassuch as the anterior cingulate, prelimbic and infralimbic regions. Correlation maps for representative subjects presented at a threshold between 0.3 ≤ z ≥ 1.2 [56].
