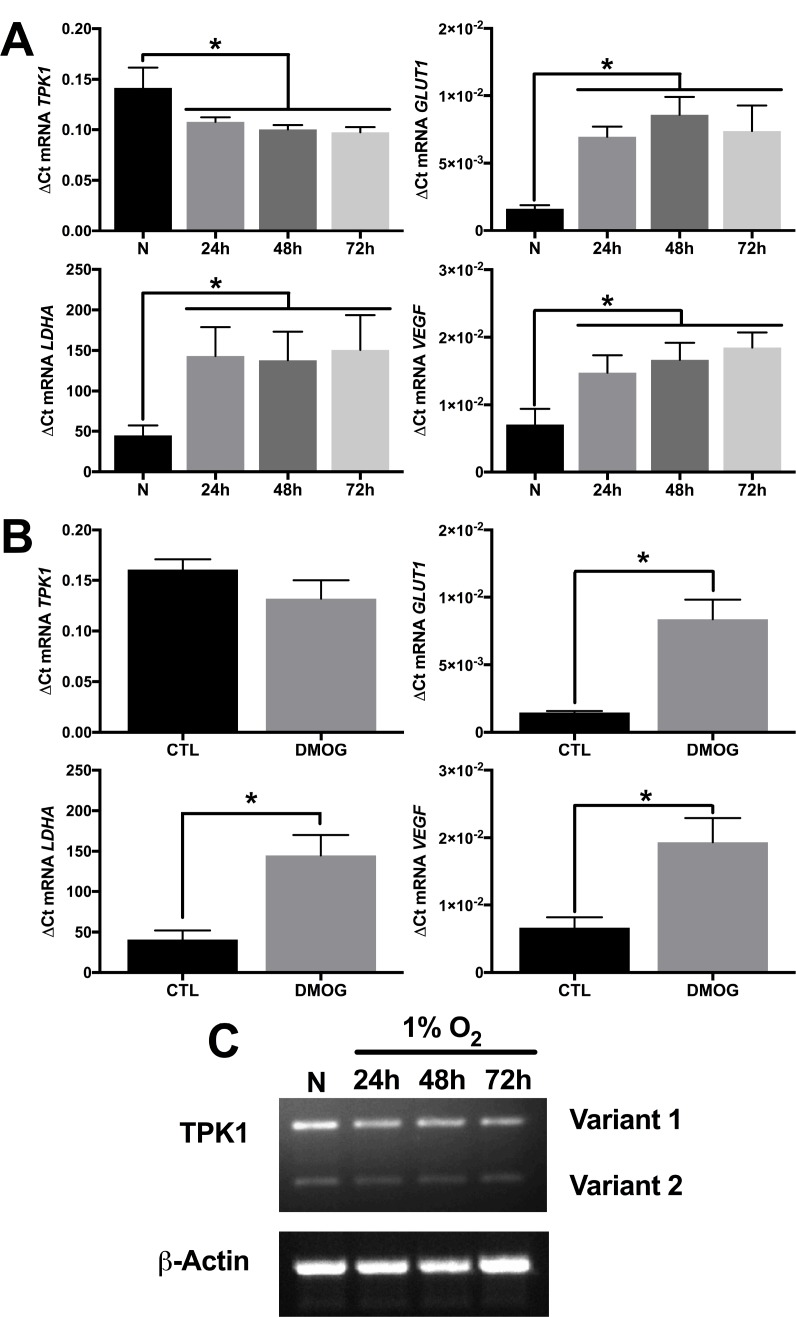
Figure 3. Increase in TPK1 protein expression lacks transcriptional involvement.
(A) Relative mRNA expression levels of TPK1, SLC2A1, LDHA, and VEGF determined by qRT-PCR analysis in wild type HCT 116 seeded at 1250 cells/cm2 and treated in 1% O2 for 24, 48, and 72 h relative to normoxic control (N) representative of n = 4 independent experiments normalized by the 2-ΔCt method. (B) Relative mRNA expression levels of TPK1, SLC2A1, LDHA, and VEGF determined by qRT-PCR analysis in wild type HCT 116 cells seeded at 1250 cells/cm2 and treated with 150 μM DMOG for 24 h relative to untreated control (CTL) representative of n = 3 independent experiments normalized by the 2-ΔCt method. (C) Qualitative TPK1 splice variant expression (1 and 2) in wild type HCT 116 cells during normoxic (N) and 24, 48, and 72 h 1% O2 exposure. β-Actin expression serves as the loading control. (*) Represents statistically significant difference (p < 0.05) based on results of (A) one-way ANOVA with Tukey’s post-hoc test or (B) unpaired student’s t-test.

