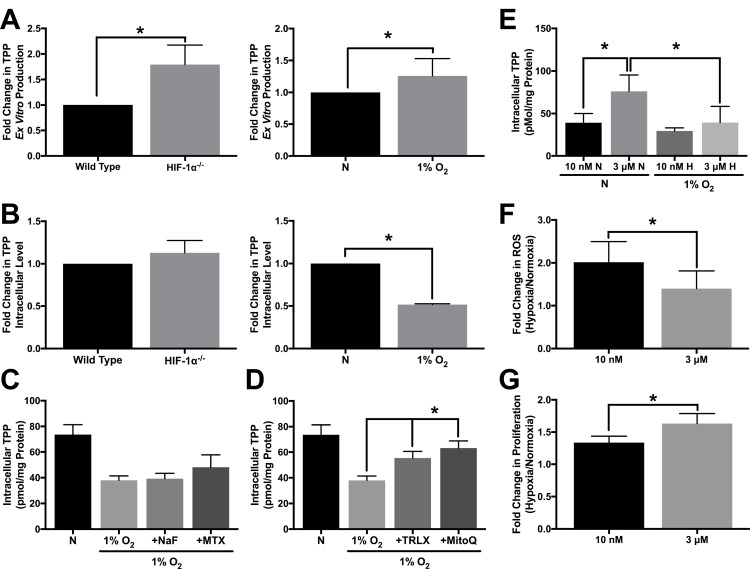
Figure 5. Altered TPP homeostasis during hypoxic stress.
(A) HPLC analysis demonstrating ex vitro TPP production as fold change in TPP ± SD comparing wild type and HIF-1α–/– HCT 116 cells seeded at 1250 cells/cm2 and cultured for 96 h or wild type cells seeded at 1250 cells/cm2 and treated with 1% O2 for 24 h relative to normoxic control (N) including n = 5 independent experiments. (B) HPLC analysis demonstrating intracellular TPP levels as fold change in TPP ± SD comparing wild type and HIF-1α–/– HCT 116 cells seeded at 1250 cells/cm2 and cultured for 96 h or wild type cells seeded at 1250 cells/cm2 and treated with 1% O2 for 24 h relative to normoxic control (N) including n = 3 independent experiments. (C, D) HPLC analysis demonstrating mean intracellular TPP levels ± SD established in wild type HCT 116 cells seeded at 25,000 cells/cm2 and pretreated with 500 μM NaF, 100 μM MTX, 500 μM TRLX or 10 μM MitoQ for 12 h prior to hypoxic exposure for 24 h with sustained exposure to each compound including n = 5 independent experiments. (E) HPLC analysis demonstrating mean intracellular TPP levels ± SD established in wild type HCT 116 cells exposed to 10 nM or 3 μM thiamine for 5 d prior to seeding at 50,000 cells/cm2 and exposure to 1% O2 for 24 h including n = 3 independent experiments for 10 nM and n = 7 independent experiments for 3 μM. (F) Effect of thiamine dose on hypoxia-induced ROS levels demonstrated by hypoxic to normoxic fold change in MitoSOX median fluorescence intensity ± SD in wild type HCT 116 cultured in 10 nM or 3 μM thiamine for 5 d prior to seeding at 50,000 cells/cm2 and exposure to 1% O2 for 48 h including n = 3 independent experiments. (G) Effect of thiamine dose on hypoxic tumor cell proliferation demonstrated by hypoxic to normoxic fold change in live cell count ± SD determined by trypan blue exclusion. Wild type HCT 116 cells were seeded at 500 cells/cm2 were grown for 5 d in either 1% O2 or normoxia including n = 5 independent experiments. (*) Represents statistically significant difference (p < 0.05) based on results of (A, B, F, G) an unpaired student’s t-test or (C–E) one-way ANOVA with Tukey’s post-hoc test.

