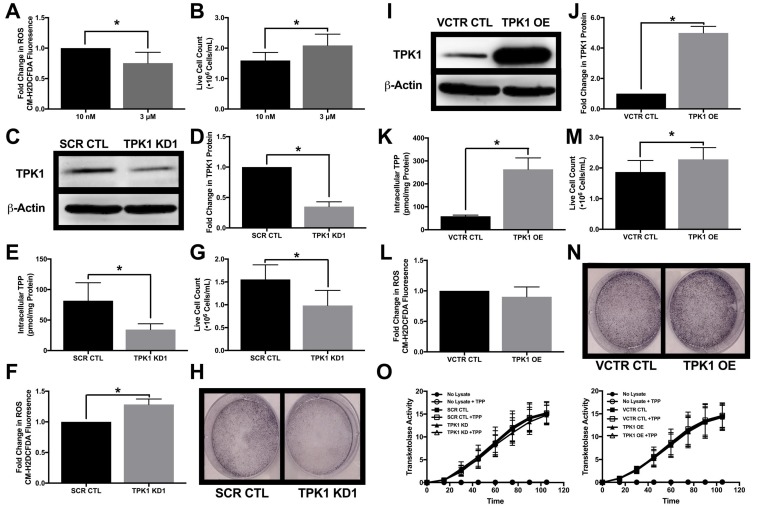
Figure 6. Impact of TPK1 on tumor cell proliferation during supplemental thiamine conditions.
(A) Fold change in CM-H2DCFDA median fluorescence intensity ± SD comparing fold change in ROS levels of wild type HCT 116 cells seeded at 10,000 cells/cm2 and supplemented with 3 μM thiamine compared to 10 nM for 5 d including n = 4 independent experiments. (B) Effect of thiamine dose on cell proliferation demonstrated by mean live cell count ± SD determined by trypan blue exclusion of wild type HCT 116 seeded at 1250 cells/cm2 supplemented with 3 μM thiamine or 10 nM for 5 d including n = 5 independent experiments. (C) Representative Western blot demonstrating TPK1 expression in WCLs isolated from wild type HCT 116 cells transfected with non-silencing scramble control (SCR CTL) or TPK1 targeted (TPK1 KD1) siRNA for 72 h. β-Actin expression serves as the loading control. (D) Densitometry analysis of the fold change in TPK1 expression ± SD for wild type HCT 116 cells transfected with TPK1 KD1 siRNA compared to SCR CTL including n = 3 independent experiments. (E) HPLC analysis demonstrating mean intracellular TPP levels ± SD established in wild type HCT 116 cells transfected with SCR CTL or TPK1 KD1 siRNA for 72 h including n = 5 independent experiments. (F) Fold change in CM-H2DCFDA median fluorescence intensity ± SD comparing fold change in ROS levels of wild type HCT 116 cells transfected with TPK1 KD1 compared to SCR CTL siRNA for 96 h including n = 6 independent experiments. (G) Effect of TPK1 knockdown on tumor cell proliferation demonstrated by mean live cell count ± SD determined by trypan blue exclusion of wild type HCT 116 cells transfected with SCR CTL or TPK1 KD1 siRNA for 96 h including n = 5 independent experiments. (H) Images of formalin fixed cells stained with crystal violet following transfection with SCR CTL or TPK1 KD1 siRNA for 96 h. (I) Representative Western blot demonstrating TPK1 expression in WCLs isolated from wild type HCT 116 cells transfected with pcDNA3.1+ vector control (VCTR CTL) or pcDNA-TPK1 (TPK1 OE) vectors for 72 h. (J) Densitometry analysis of the fold change in TPK1 expression ± SD for wild type HCT 116 cells transfected with TPK1 OE compared to VCTR CTL including n = 3 independent experiments. (K) HPLC analysis demonstrating mean intracellular TPP levels ± SD established in wild type HCT 116 cells transfected with VCTR CTL or TPK1 OE vectors for 72 h including n = 3 independent experiments. (L) Fold change in CM-H2DCFDA median fluorescence intensity ± SD comparing fold change in ROS levels of wild type HCT 116 cells transfected with TPK1 OE compared to VCTR CTL for 96 h including n = 3 independent experiments. (M) Effect of TPK1 overexpression on tumor cell proliferation demonstrated by mean live cell count ± SD determined by trypan blue exclusion of wild type HCT 116 cells transfected with VCTR CTL or TPK1 OE vectors for 96 h including n = 5 independent experiments. (N) Images of formalin fixed cells stained with crystal violet following transfection with VCTR CTL or TPK1 OE vectors for 96 h. (O) The average rate of TKT activity quantified from the reduction of NADH over time ± the addition of exogenous TPP in lysates isolated from wild type HCT 116 cells transfected with SCR CTL and TPK1 KD1 siRNA or VCTR CTL and TPK1 OE vectors for 72 h including n = 3 independent experiments for both conditions. (*) Represents statistically significant difference (p < 0.05) based on results of an unpaired student’s t-test.

