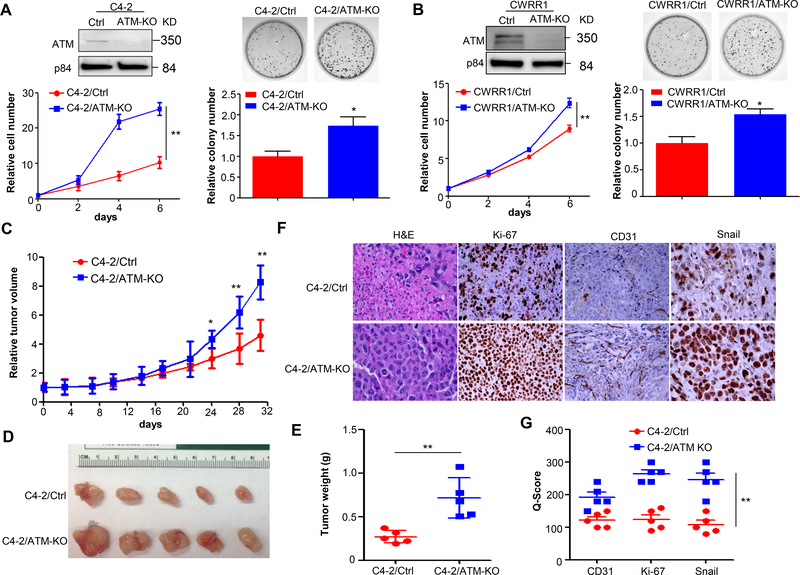
Figure 1.
ATM deficiency promotes CRPC progression. (A&B) Cell proliferation (left panel) and colony formation (right panel) of C4–2/Ctrl vs. C4–2/ATM-KO cells and CWRR1/Ctrl vs. CWRR1/ATM-KO cells generated by CRISPR/Cas9 technology. Top, nuclear lysates were extracted and ATM expression was determined by Western blot. p84 was used as a loading control. Bottom, cell proliferation was measured by MTS assay at each indicated time points and normalized to Day 0 (n = 3 replicates). Colony formation assay was performed for C4–2/Ctrl vs. C4–2/ATM-KO cells and CWRR1/Ctrl vs. CWRR1/ATM-KO cells. Top, representative images for formed colonies. Bottom, graphs showing the quantifications of colonies formed (n = 3 replicates). (C) Xenograft tumor growth of C4–2 stable cell lines generated in (A). Tumor volumes were measured twice a week and normalized to Day 0 (n = 5 mice per group). (D) Representative tumors in each group. (E) The weight of xenograft tumors obtained at the end of animal study (n = 5 mice per group). (F) Representative images of H&E and IHC analysis of CD31, Ki-67 and Snail in xenografts obtained from (E). Magnification: 200×. (G) A plot of Quick-score for IHC staining in (F). All data are depicted as mean±s.d. * p < 0.05 and ** p < 0.01 by two-tailed Student’s t-test.

