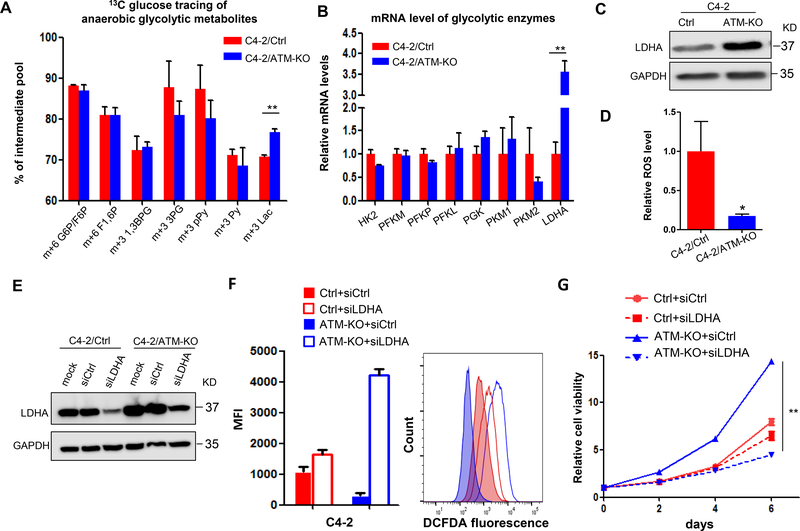
Figure 4.
ATM deficiency upregulates LDHA to promote CRPC progression. (A) 13C-isotopomer tracing analysis of glucose-derived glycolytic metabolites in C4–2/Ctrl and C4–2/ATM-KO cells (n = 3). G6P, glucose 6-phosphate; F6P, fructose 6-phosphate; F1,6 P, fructose 1,6-bisphosphate; 1,3BPG, 1,3-bisphosphoglycerate; 3PG, 3-phosphoglycerate; pPy, phosphoenolpyruvate; Py, pyruvate; Lac, lactate. (B) RT-qPCR to determine the mRNA levels of glycolytic enzymes. Data are normalized to the control group (n = 3 independent experiments). HK, hexokinase; PFK, phosphofructokinase; PGK, phosphoglycerate kinase; PK, pyruvate kinase; LDHA, lactate dehydrogenase A. (C) Western blot to determine LDHA protein expression. GAPDH was used as a loading control. (D) Relative level of intracellular ROS. Results are normalized to control group (n = 3 independent experiments). (E) C4–2/Ctrl and C4–2/ATM-KO cells were transfected with siRNAs targeting either a scramble sequence (siCtrl) or LDHA (siLDHA). Western blot confirmed knockdown of LDHA expression by using siRNAs. GAPDH was used as a loading control. (F) Intracellular ROS production was detected with DCFDA fluorescence and monitored by flow cytometry at 24 hours post-transfection with siCtrl or siLDHA. Left, median fluorescent intensity. Right, the representative image of histograms of ROS (n = 3 independent experiments). (G) Cell viability of C4–2/Ctrl and C4–2/ATM-KO cells transfected with siCtrl and siLDHA was determined by MTS assay at the indicated time points (n = 3 replicates). All data are depicted as mean ± s.d. * p < 0.05 and ** p < 0.01 by two-tailed Student’s t-test.

