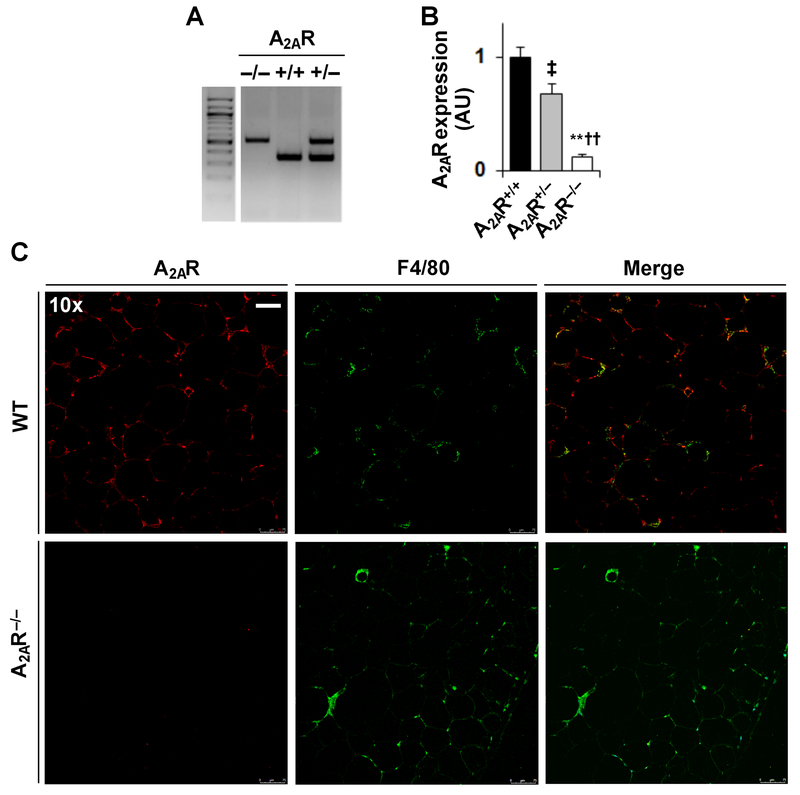
Figure 2. Validation of adipose tissue A2AR disruption.
(A) Genomic DNA was subjected to PCR analysis for genotyping of homozygous A2AR-disrupted (A2AR−/−) mice, heterozygous A2AR-disrupted (A2AR+/−) mice and their wild-type (WT, A2AR+/+) littermates. (B,C) Adipose tissue A2AR disruption. Male A2AR-dirupted (A2AR−/− and A2AR+/−) mice and A2AR+/+ mice, at 5 - 6 weeks of age, were fed an HFD for 12 weeks. For B, adipose tissue (epididymal fat) mRNA levels of A2AR were quantified using real-time RT-PCR. Data are means ± SEM. n = 8 - 10. Statistical difference between A2AR−/− and A2AR+/+: **, P < 0.01; statistical difference between A2AR−/− and A2AR+/−: ††, P < 0.01; statistical difference between A2AR+/‒ and A2AR+/+: ‡, P < 0.05. For C, adipose tissue (epididymal fat) sections were subjected to immunofluorescent staining of A2AR and/or F4/80 expression. The scale bar is 75 µm for 10× images.

