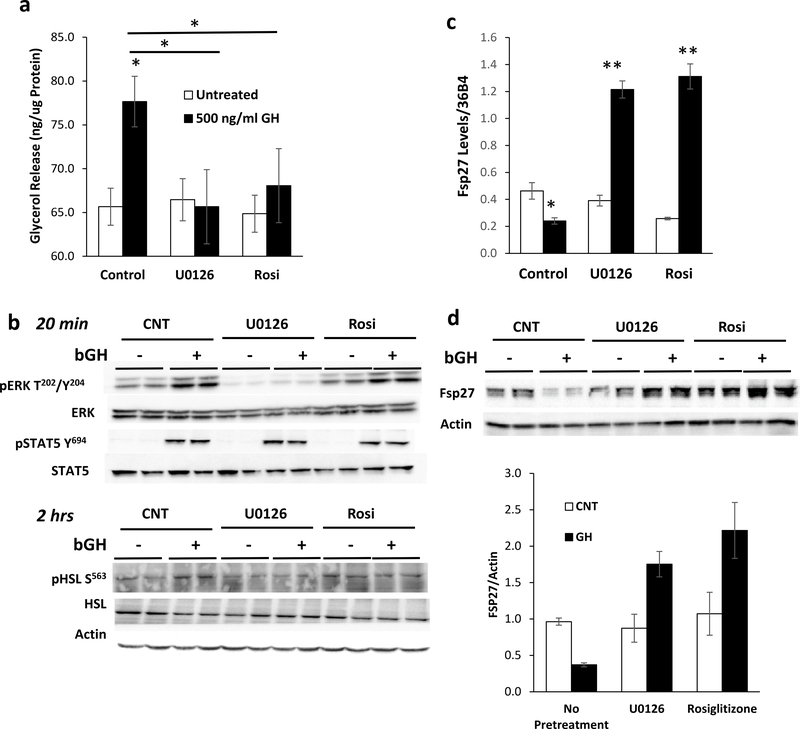
Figure 2. GH Regulates Lipolysis in a MEK and Pparγ Dependent Manner.
a) Lipolysis as measured by glycerol release from 3T3-L1 adipocytes treated with 500ng/mL bGH for 2 hours after 2 hours of pre-treatment with 10 μM U0126 or 1 μM Rosiglitazone. Data are shown as mean ± SEM of 3 independent experiments. Asterisks indicate a significant differences in all panels * p<0.05; **p<0.01.
b) Representative Western blot analysis of pERK T202/Y204 , total ERK, pSTAT5 Y694, total STAT5, pHSL S563 , and total HSL in 3T3-L1 adipocytes treated with 500ng/mL bGH for either 20 minutes or 2 hours after 2 hours of pre-treatment with 10 μM U0126 or 1 μM Rosiglitazone. Actin is used as a loading control.
c-d) qPCR and Western blot analysis of FSP27 mRNA and protein isolated from cells treated with 500ng/mL bGH for 2 hours after 2 hours of pre-treatment with 10 μM U0126 or 1 μM Rosiglitazone. Actin is used as a loading control. Quantitation of Western blot data are shown as mean ± SEM of 4 independent experiments.

