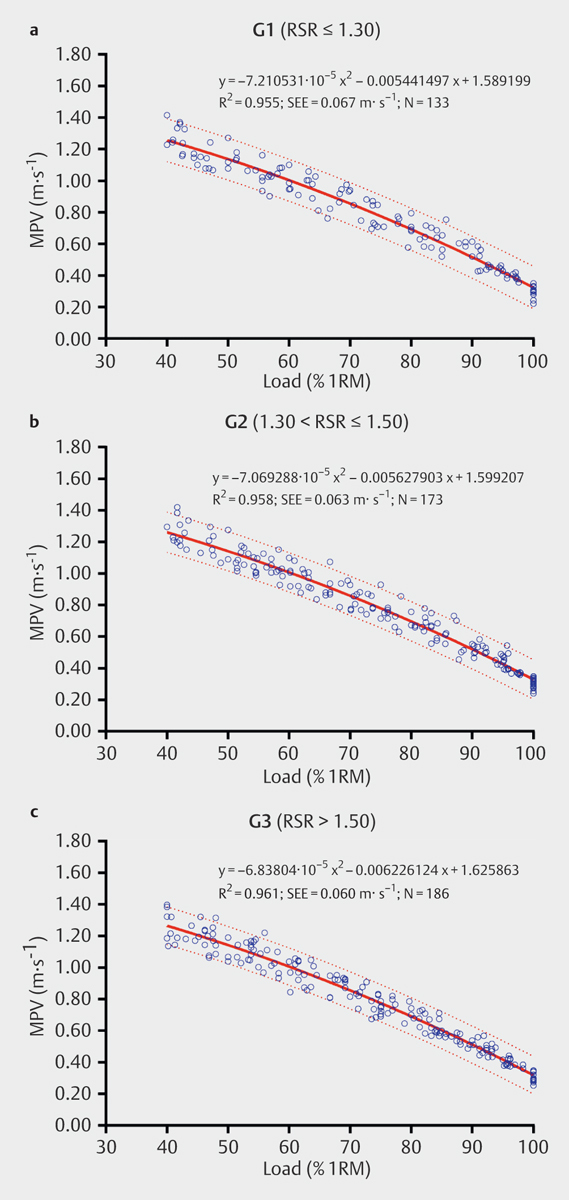
Fig. 3.

Relationships between relative load (%1RM) and mean propulsive velocity (MPV) in the squat exercise for the 3 subgroups of different relative strength ratio (RSR) that made up the sample: a G1 (n=24, RSR≤1.30); b G2 (n=29, 1.30<RSR≤1.50); and c G3 (n=27, RSR>1.50). Dotted lines indicate limits within which 95% of predictions will fall.
