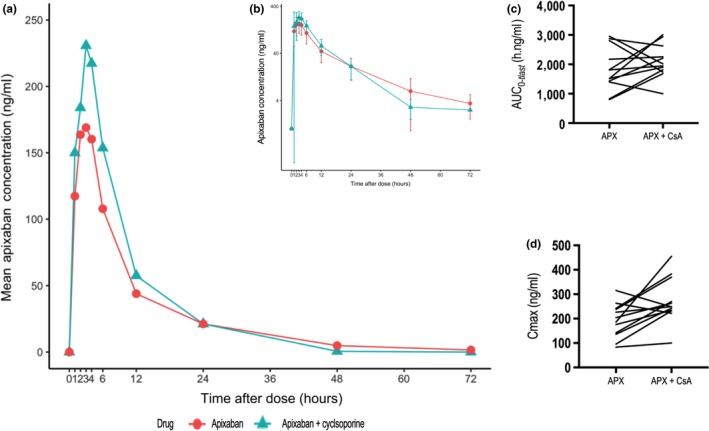
Figure 2.

Plasma concentration‐time profiles and pharmacokinetic parameters of apixaban (APX) with and without cyclosporine (CsA). Mean plasma concentration‐time profiles of apixaban in 12 healthy subjects following a single 10 mg oral dose of apixaban alone or in the presence of 3 daily doses of 100 mg cyclosporine; apixaban plasma concentration is presented on a linear scale (a) and log‐transformed scale (b), error bars show SD; comparison of area under the plasma concentration‐time curve from time zero to the last quantifiable concentration (AUC (0–tlast)) (c) and maximum plasma concentration (C max) (d) with and without cyclosporine.
