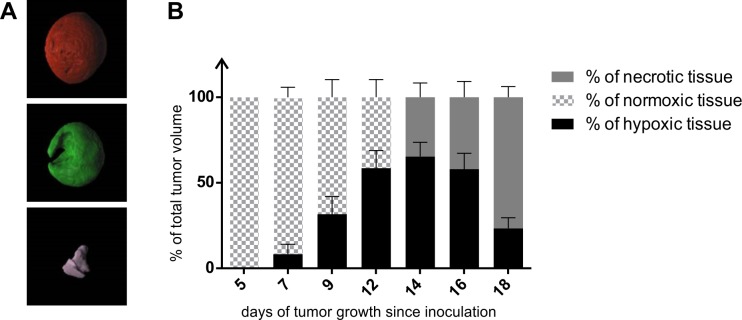
Fig 4. Regions of normoxia, hypoxia and necrosis in developing CT26 tumors.
A–Surface rendered tumor (CT26) at the day 16 of development based on the CT measurement (red) and its hypoxic (green) and necrotic (violet) regions based on the [18F]FMISO labeling detection using PET. B–Graph showing percentage of CT26 tumor normoxia, hypoxia and necrosis at various stages of its development (from day 5 till day 18) measured using [18F]FMISO PET-CT imaging.

