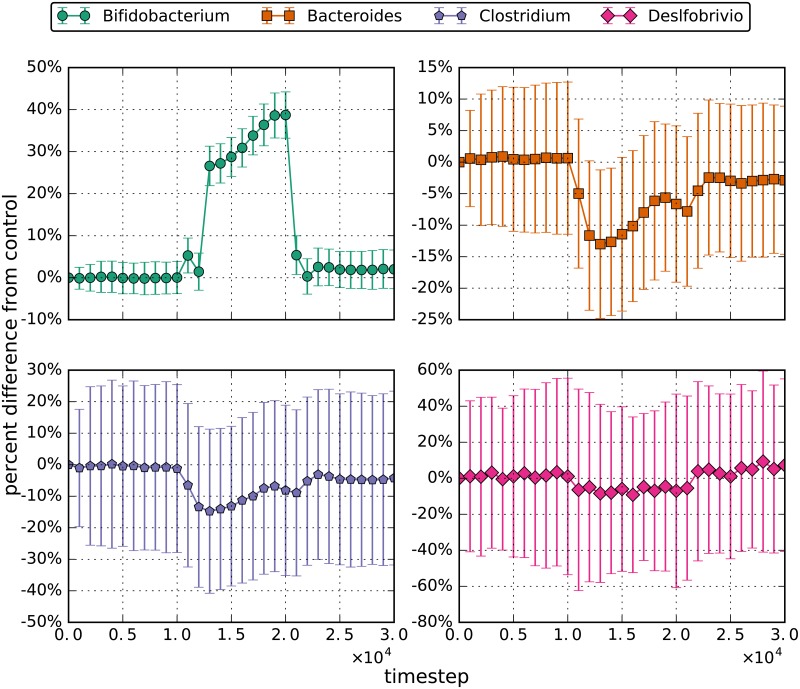
Fig 4. Percent difference from the control for the the lesser probiotic (low dose) simulations.
The errorbars are the 95% confidence interval for the distributions. During the perturbation interval of the simulation, 5000 bifidobacteria enter the left side of the simulated area every 3.5 simulated hours or 480 timesteps.

