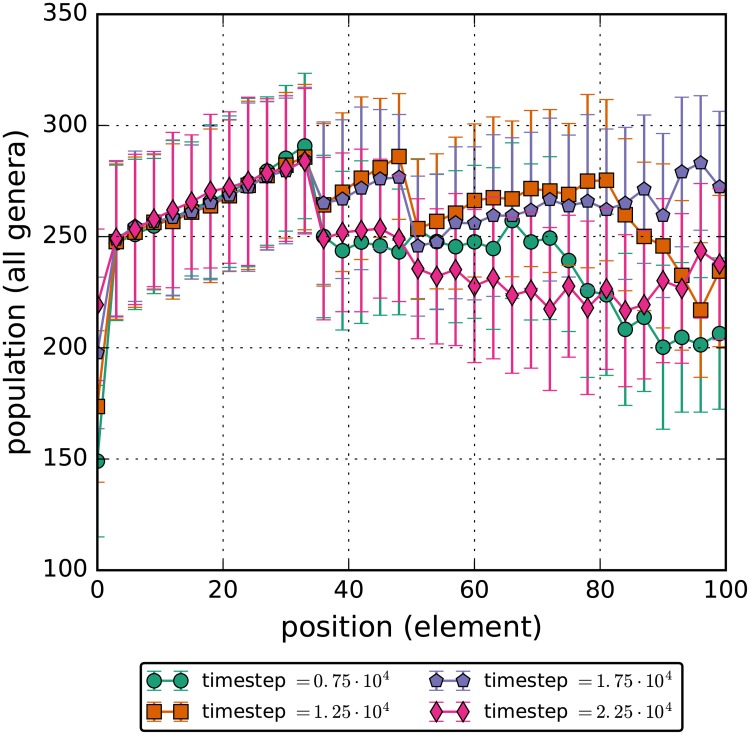
Fig 9. Total number of bacteria in each of the elements.
The glucose flux is increased to double of the unperturbed rate for the timesteps between 1.0 ⋅ 104 and 2.0 ⋅ 104. The increase in glucose results in an approximately equal increase in bacteria populations throughout the simulation length. The populations rapidly return to pre-perturbation levels after the glucose levels are returned to initial conditions.

