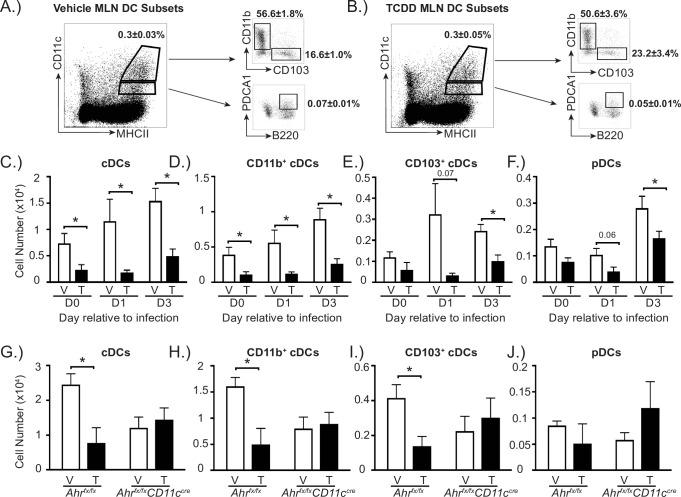
Fig 3. Activation of AHR during development reduces DCs in the MLN in an AHR-dependent manner.
Mice were exposed to vehicle or TCDD during development. At maturity, developmentally exposed offspring were unchallenged, or infected with IAV (HKx31). The percentage and number of DC subsets in the MLN were determined by flow cytometry. (A, B) Following gating to exclude doublets and auto-fluorescent cells, DCs were identified as follows: conventional DCs (cDCs; CD11chiMHCIIhi cells) and plasmacytoid DCs (pDCs; CD11cloMHCIIhi PDCA1+CD45R+ cells). Conventional DCs were further subdivided into two populations: CD11b+ cDCs (CD11b+CD103-CD11chiMHCIIhi cells) and CD103+ cDCs (CD103+CD11b-CD11chiMHCIIhi cells). Representative dot plots depict the gating used to define cDCs, CD11b+ cDCs, CD103+ cDCs and pDCs in the MLN of vehicle (A) and TCDD (B) exposed offspring. The dot plots indicate the average percentage (±SEM) of the indicated DC subset 3 days after infection. (C-F) The bar graphs show the number (±SEM) of the indicated DC population in MLN from naïve (day 0) or infected mice. (G-J) Bar graphs show the number (±SEM) of DC in the MLN 3 days after IAV infection in Ahrfx/fx or Ahrfx/fxCD11ccre mice from V or T dams treated with 10 μg/kg BW TCDD on GD14 and PND2. At each point in time, all wildtype offspring within a group were from a separate dam, n = 6–9 mice per group per day. Some Ahrfx/fx or Ahrfx/fxCD11ccre mice offspring within a group were from the same dam, n = 3–5 mice per group, because of limited number of offspring. Day 0 data are representative of 4 independent experiments, day 1 data are representative of 3 independent experiments, day 3 data are representative of 6 independent experiments with similar results. The experiment using Ahrfx/fxCD11ccre mice was performed once. An * indicates p ≤ 0.05. Underlying data can be found in S1 Data.

