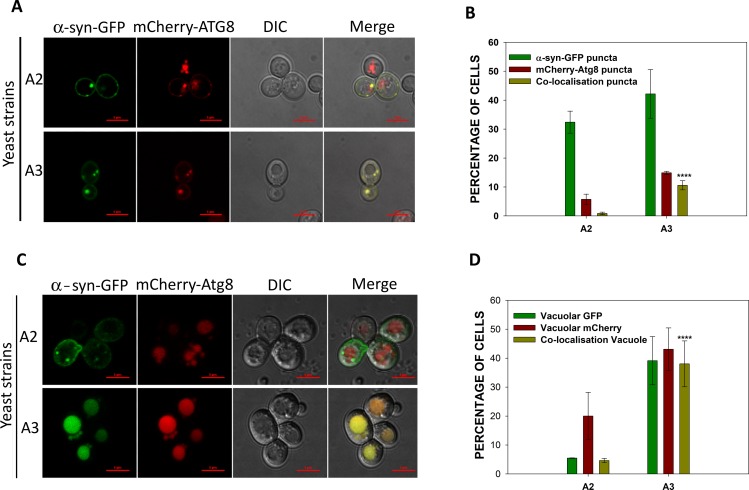
Fig 7. Co-localization of α-syn-GFP with autophagosomes, or vacuoles was higher in A3 than in A2 cells.
Both strains A2 and A3 co-expressed α-syn-GFP and mCherry-Atg8. (A) Confocal microscopy images of representative cells. The α-syn-GFP expression was induced in galactose media for 12 h prior to collecting the cells for analysis by confocal microscopy. (B) The frequency of cells showing α-syn, mCherry, or co-localized puncta. (C) Representative confocal microscopy images of cells showing the presence of α-syn, or mCherry in vacuoles. (D) Frequency of cells showing vacuolar GFP or mCherry. Only those cells that showed GFP fluorescence were further examined for mCherry fluorescence. Error bars represent the standard error of more than 200 cells evaluated. P-value was calculated using paired t-test. Scale bar measures 5 μM.

