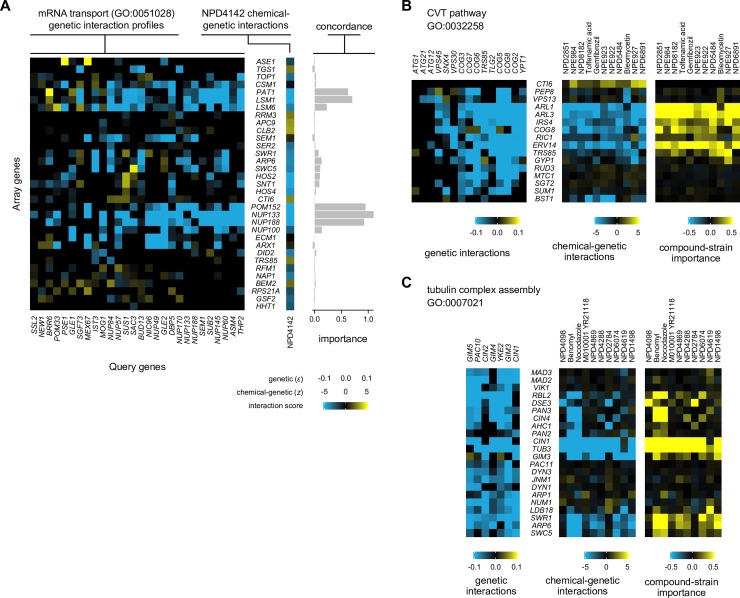
Fig 4. Detailed analysis of the contribution of individual gene mutants to biological process predictions.
Each panel shows, for a bioprocess and either a compound (A) or a set of compounds (B-C) predicted to perturb that bioprocess, the subset of the respective chemical-genetic and L2-normalized genetic interaction profiles with signal. The importance profiles are the row-wise mean of the Hadamard product (elementwise multiplication) of each chemical-genetic interaction profile and the genetic interaction profiles for query genes with which it possessed an inner product of 2 or higher that are annotated to the GO term; they reflect the strength of each strain’s contribution to the bioprocess prediction. For all panels, a query gene from the genetic interaction network was selected if it contributed to the importance score calculation for any selected compound; query genes were ordered from left to right in ascending order of their inner products (or their average, for B-C) with the selected chemical-genetic interaction profile(s). Each strain (row) was included if it passed at least one of three criteria: 1) the magnitude of its mean genetic interaction score across the selected query genes exceeded 0.04; 2) the magnitude of its chemical-genetic interaction score (for B-C, the mean of such scores) exceeded 2.5; or 3) its importance score exceeded 0.1 (for B-C, the mean of such scores). (A) Schematic showing the prediction of the “mRNA transport” bioprocess (GO:0051028) for chemical compound NPD4142. (B) Schematic showing the prediction of “CVT pathway” (FDR < 1%) for compounds whose top prediction was to that term. (C) Schematic showing the prediction of “tubulin complex assembly” (FDR <1%).

