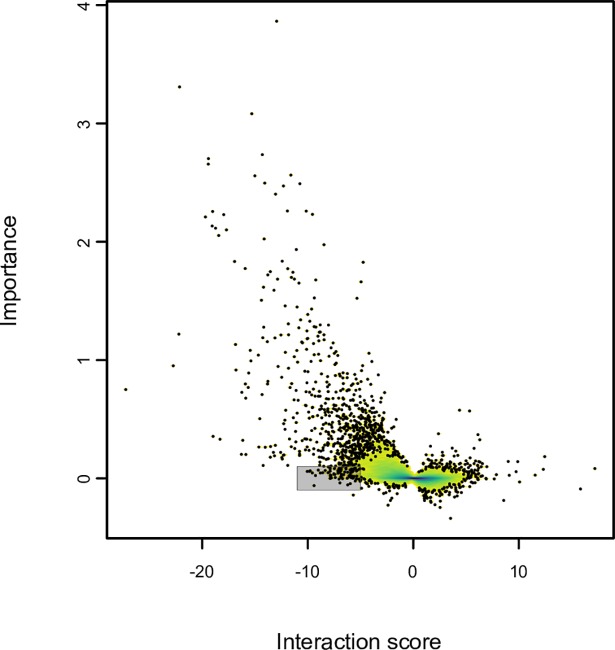
Fig 5. Global visualization of the contribution of chemical-genetic interactions to CG-TARGET bioprocess predictions.
Chemical-genetic interaction profiles and their corresponding importance score profiles (see Fig 4 legend) were gathered for each of 130 diverse compounds from the high confidence set (FDR ≤ 25%) and their associated top bioprocess predictions. Importance is plotted as a function of chemical-genetic interaction score. One thousand points from the regions of lowest density (white) are plotted, with only density plotted in the remaining higher-density regions. Density increases in order of white, yellow, green, and violet. The shaded region highlights strains with strong negative (≤ –5) chemical-genetic interactions and no contribution (± 0.1) to a compound’s top bioprocess prediction.

