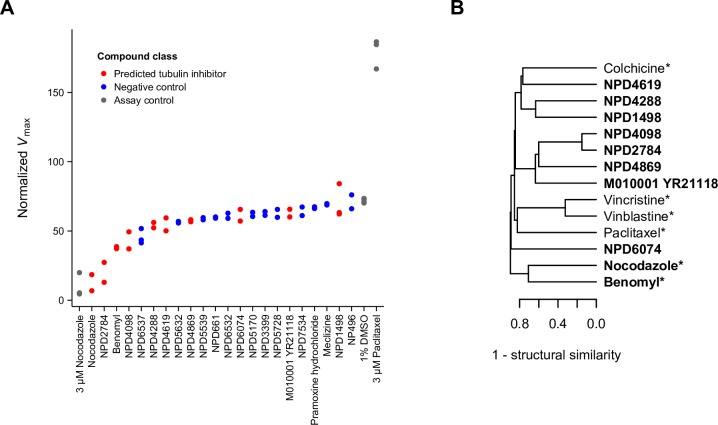
Fig 7. In vitro experimental validation of “tubulin complex assembly” biological process predictions.
(A) In vitro inhibition of tubulin polymerization by compounds predicted to perturb “tubulin complex assembly” (FDR < 1%; red) compared to randomly-selected negative control compounds with high-confidence predictions to bioprocesses not related to chromosome segregation, kinetochore, spindle assembly, and microtubules (blue). Vmax values reflecting the maximum rate of tubulin polymerization for each compound from independent replicate experiments are plotted. Assay positive and negative control compounds are colored grey. (B) Structural similarity-based hierarchical clustering of compounds tested in (A). Single linkage was used in combination with (1 –structural similarity) as the distance metric; as such, the structural similarity of the two most similar compounds at each junction can be inferred directly from the dendrogram. Compounds predicted to perturb “tubulin complex assembly” (FDR < 1%) are in bold, and known microtubule-perturbing agents are marked with an asterisk. Structural similarity was calculated as the Braun-Blanquet similarity coefficient on all-shortest-path chemical fingerprints of length 8 (see Materials and Methods).

