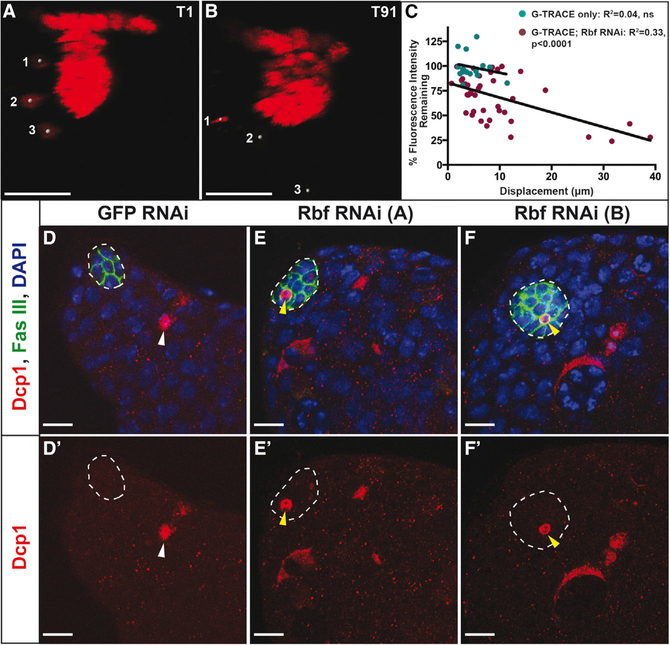
Figure 3. Rbf Knockdown in the Hub Causes Migration of Converting Hub Cells and Hub Cell Death.
(A and B) Still frames from live images of E132ts > G-TRACE; Rbf RNAi testes shifted for 10 days at 29°C. Testes were imaged live for approximately 15 hr, with images acquired every 10 min. Images show red channel only.
(A) Time frame 1 (T1) shows three hub cells marked by gray circles that have already left the main hub cluster.
(B) By the last time frame (T91), the hub cell marked 1 has undergone cell death, as seen through the condensation of its DNA. The other two marked hub cells (2 and 3) have traveled farther from the main hub cluster and have lost red fluorescent expression, indicating that they are no longer hub cells.
(C) Dot plot depicting the displacement from T1 to T91 versus the percentage of red fluorescence expression remaining at T91 compared with T1. Green dots show individual hub cells from control testes expressing G-TRACE only (n = 15), while red dots show individual hub cells from testes expressing G-TRACE and Rbf RNAi in the hub (n = 42). Linear regression analysis shows a significant correlation (R2 = 0.33, p < 0.0001) between the displacement of a hub cell and the amount of fluorescence it loses in testes in which Rbf has been knocked down. Control testes show no such correlation (R2= 0.04, ns). See also Videos S2 and S3.
(D–F) Single confocal sections through the testis apex of testes fixed and immunostained for Dcp1 (dying cells; red), Fas III (hub; membranous green), and DAPI (nuclei; blue). Hubs are outlined in white. E132ts flies expressing either GFP RNAi (D) or Rbf RNAi (E and F) were shifted to 29°C for 7 days to induce RNAi knockdown.
(D and Dʹ) Dying cells can be seen within control testes (white arrowhead) but are never seen within the hub. Merged (D) and Dcp1 only (Dʹ) channels are shown.
(E–Fʹ) Rbf knockdown in hub cells using two independent RNAi lines denoted A (E and Eʹ) and B (F and Fʹ) causes hub cell apoptosis, as indicated by shrinking hub cells that are marked with Dcp1 throughout the entire cell (yellow arrowheads). Merged (E and F) and Dcp1 only (Eʹ and Fʹ) channels are shown.
Scale bars represent 15 μm (A and B) and 10 μm (D–F).

