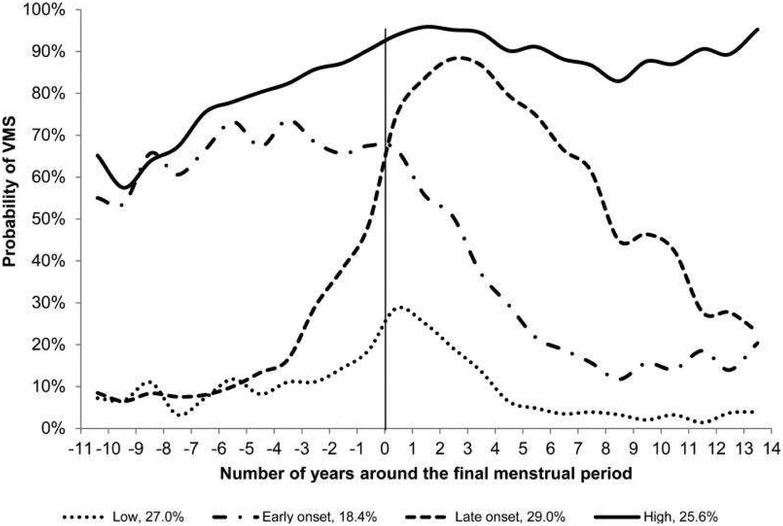
Figure 2:
Trajectories of Vasomotor Symptoms over the Menopause Transition VMS indicates vasomotor symptoms. Probability of VMS represents the average observed probability of VMS at each time point within each trajectory subgroup. No factors were included in the model. From Tepper PG, Brooks MM, Randolph JF, et al. Characterizing the trajectories of vasomotor symptoms across the menopausal transition. Menopause 2016;23(10):1067–74; with permission.

